Executive summary
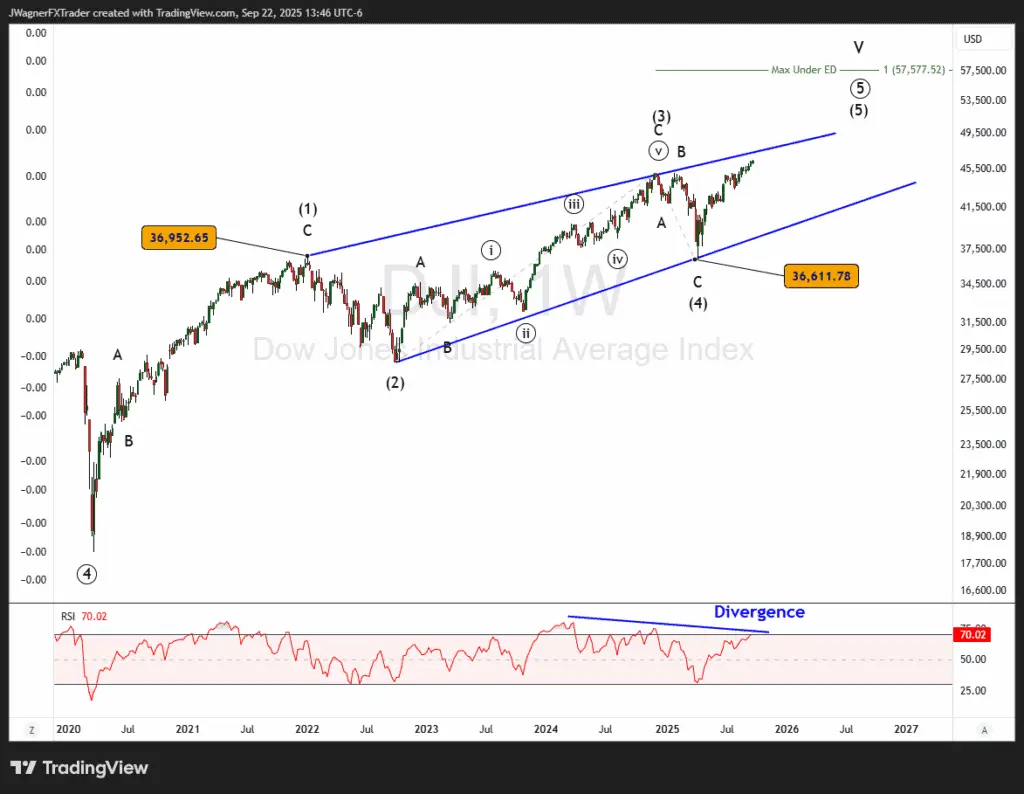
- Trend bias: TheDow Jones Industrial Average (DJI)appears to be near the end of a long-termbullish diagonal, wave ((5)) of a larger degree.
- Key level: ~40,000,near the blue support trend line on a weekly chart.
- If 40,000 breaks, then a decline would target wave (4) low of 36,611 and then wave ((4)) low of 18,213.
Current Elliott Wave analysis

TheDJIis progressing within anElliott wavefiveat three degrees of trend.
Primary wave ((5)) began in 2020 and has rallied in an ending diagonal shape. An ending diagonal takes the shape of arising wedgein traditional technical analysis. Within the ending diagonal, prices would rally in 5 waves. It appears wave (4) of ((5)) completed at the April 2025 low. Therefore, the rally since April is wave (5) of ((5)).
One of the rules within Elliott wave is that wave 3 cannot be the shortest wave between waves 1, 3, and 5. If we take theFibonacci extensiontool and measure the length of wave (3) and project it at the end of wave (4), we see a maximum level for (5) under the ending diagonal scenario is 57,577.
That may seem like quite a distance away, but this would be the maximum under the pattern. Each wave of the diagonal would subdivide as a zigzag or multiple zigzag pattern.
Therefore, it is possible that DJI tops within the next couple of weeks in wave A of (5) or all of wave (5).
Once DJI breaks the upward slopingsupport trend line, then we’ll consider a major top in place.
Bottom line
TheDJI is nearing the end of a bullish wave.The current Elliott wave appears to be wave (5) of ((5)). We are uncertain if this is just wave A of (5) or all of wave (5). Either way, theRSI divergencesuggests that momentum is slowing an a correction may be nearby.