
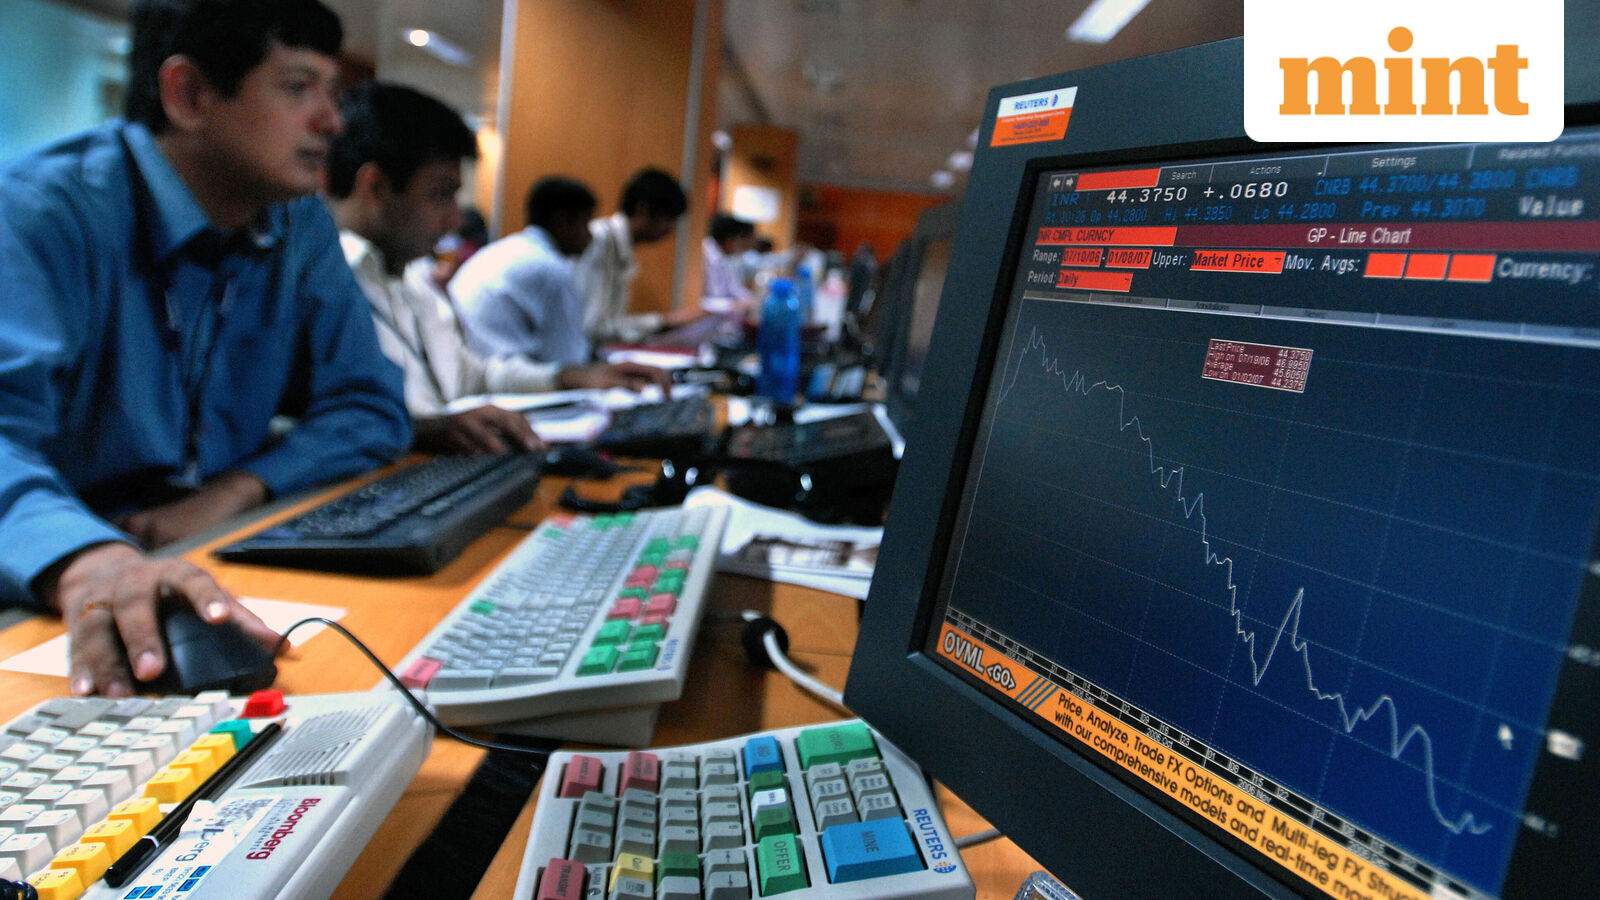
The Indian stock market benchmark indices, Sensex and Nifty 50, are likely to open flat on Friday, tracking mixed global market cues, as investors watch the meeting between the US President Donald Trump and Chinese President Xi Jinping.
The trends on Gift Nifty also indicate a flat start for the Indian benchmark index. The Gift Nifty was trading around 23,679 level, a discount of nearly 21 points from the Nifty futures’ previous close.
On Thursday, the Indian stock market witnessed a short covering rally, with the benchmark Nifty 50 closing above 23,600 level.
People also ask
AI powered insights from this story
•5 QUESTIONS
The Indian stock market benchmarks, Sensex and Nifty 50, are expected to open flat on May 15th, tracking mixed global market cues. Gift Nifty also indicated a flat start, trading at a discount to Nifty futures.
On the previous trading day, the Sensex surged 789.74 points to close at 75,398.72, while the Nifty 50 settled 277.00 points higher at 23,689.60.
The Sensex has formed a promising reversal pattern on intraday charts and a bullish candle on daily charts, supporting a further uptrend. Key support zones are identified at 74,800 and 75,100.
Immediate support for the Nifty 50 is placed around the 23,500 level, with resistance seen in the 23,900 – 23,950 range. A sustainable move above 23,800 could lead to further upside.
The Bank Nifty shows a neutral to slightly positive near-term outlook. Immediate support is seen in the 53,600 – 53,500 zone, while resistance is expected around the 54,700 – 54,800 zone. A move above 54,800 could target 55,300.
The Sensex surged 789.74 points, or 1.06%, to close at 75,398.72, while the Nifty 50 settled 277.00 points, or 1.18%, higher at 23,689.60.
Here’s what to expect from Sensex, Nifty 50 and Bank Nifty today:
Sensex Prediction
On intraday charts, it has formed a promising reversal pattern, and on daily charts, it has formed a bullish candle, which supports further uptrend from the current levels.
“For day traders, 74,800 and 75,100 would act as key support zones. Above these levels, the pullback formation is likely to continue. On the higher side, Sensex could move up to the 50-day SMA (Simple Moving Average) or 76,200. Further upside may also continue, potentially lifting the index to 76,500 – 76,700,” said Shrikant Chouhan, Head Equity Research, Kotak Securities.
However, he believes the uptrend would become vulnerable below 74,800, and in that case, traders may prefer to exit their long positions.
Nifty Options Data
In the derivatives segment, notable call writing was observed at the 23,800 and 23,700 strikes, while put writing was concentrated at the 23,500 and 23,600 strikes, indicating a broader recovery sentiment with support shifting higher.
Nifty 50 Prediction
Nifty 50 formed a Morning Doji Star candlestick pattern on the daily timeframe, which is generally considered a bullish reversal formation.
“A long bull candle was formed on the daily chart, which indicates short term reversal in the market on upside. Nifty 50 is now placed at the crucial hurdle of 23,800 (previous swing lows as per the concept of change in polarity) and a sustainable move above this hurdle could open more upside towards 24,500 levels in the near term,” said Nagaraj Shetti, Senior Technical Research Analyst at HDFC Securities.
According to him, the immediate support to be watched is around 23,500 levels.
Sachin Gupta, VP – Research at Choice Broking noted that the daily chart pattern indicates buying interest has emerged from lower levels and suggests a possibility of further recovery if the Nifty 50 index sustains above crucial resistance levels.
“From a technical perspective, immediate support is placed in the 23,450 – 23,500 zone, while resistance is seen in the 23,900 – 23,950 range. The Relative Strength Index (RSI) stands at 45.86, indicating improving momentum though it still remains below the stronger bullish zone. The volatility index, India VIX, declined by 4.18% to 18.61, indicating easing volatility and improving market confidence,” said Gupta.
Bank Nifty Prediction
Bank Nifty ended 672.80 points, or 1.26%, higher at 54,128.95 on Thursday, and continues to trade below its key moving averages, while momentum indicators suggest a sideways trend in the near term.
“Going ahead, the 54,700 – 54,800 zone is expected to act as an immediate hurdle. A sustained move above 54,800 could extend the pullback rally towards the 55,300 level. On the downside, the 53,600 – 53,500 zone is likely to serve as a crucial support,” said Sudeep Shah, Head – Technical and Derivatives Research at SBI Securities.
Om Mehra, Technical Research Analyst, SAMCO Securities highlighted that the Bank Nifty index tested the lower Bollinger Band placed at 53,350 and reversed from that zone, and formed a bullish candle on the daily chart.
“On the hourly chart, a double bottom formation is visible. However, the 54,400 – 54,300 zone also coincides with the prior support-turned-resistance band on the daily chart. A sustained move above this neckline would confirm the pattern and open room for further upside extension. The RSI has improved to 44, recovering from below 39. Nonetheless, Nifty Bank continues to trade well below the middle Bollinger Band,” said Mehra.
On the downside, he believes the 53,700 – 53,500 zone remains the immediate support area, while on the upside, the 54,500 – 54,700 zone is likely to act as resistance.
“The near-term outlook has turned neutral to slightly positive,” Mehra added.
Disclaimer: The views and recommendations made above are those of individual analysts or broking companies, and not of Mint. We advise investors to check with certified experts before making any investment decisions.