Top 3 stocks recommended by Ankush Bajaj
Buy: Aditya Birla Capital Ltd (current price: ₹196)
Why it’s recommended: After a good bullish move, we have seen some selling pressure in this stock and it has retested the ₹193 zone again. Expecting a bounce back.
Key metrics: Retest level: ₹193, Chart pattern: Retest after bullish move, Time frame: Hourly
Technical analysis:A bullish retest near the ₹193 support zone suggests upside momentum. The stock is likely to move towards its next resistance levels.
Risk factors:Financial sector stocks may face price volatility due to changes in interest rates, credit growth fluctuations, and macroeconomic conditions.
Buy at: ₹196
Target price: ₹202– ₹205 in 1–2 weeks
Stop loss: ₹193
Also read | Hindustan Unilever: Profit margin takes a back seat to growth
Buy: SBI Life Insurance Co Ltd (current price: ₹1695)
Why it’s recommended: On daily and hourly charts, the stock trend is up. It was one of the top performers on Friday. Expecting this rally to continue with EMA and volume confirmation.
Key metrics: Support level: ₹1640, Chart pattern: Uptrend continuation with EMA and volume confirmation, Time frame: Daily and Hourly
Technical analysis: A strong uptrend on multiple time frames along with EMA and volume support suggests continuation of the bullish momentum. The stock is likely to move towards its next resistance levels.
Risk factors: Insurance sector stocks may face price volatility due to regulatory changes, market sentiment towards financial services, and interest rate fluctuations.
Buy at: ₹1,695
Target price: ₹1,760– ₹1,780 in 1–2 weeks
Stop loss: ₹1,640
Buy: Delhivery Ltd (current price: ₹304.90)
Why it’s recommended: On the daily chart, the MACD signal line is above the MACD line and RSI is above 60, indicating a strong uptrend. Also, on shorter time frames, the stock has support around ₹292 level. Expecting an uptrend with ₹292 as the stop loss.
Key metrics: Support level: ₹292, Chart pattern: MACD and RSI bullish setup, Time frame: Daily and Lower Time Frame
Technical analysis: A bullish MACD crossover along with RSI above 60 and strong support on lower time frames suggests further upside momentum. The stock is likely to move towards its next resistance levels.
Risk factors: Logistics stocks may face volatility due to changes in fuel prices, demand fluctuations, and overall economic conditions.
Buy at: ₹304.90
Target price: ₹319– ₹322 in 1–2 weeks
Stop loss: ₹292
Market Update: Nifty slips after slight gap-up as geopolitical tensions drag markets
The Nifty 50 ended the day down 207.35 points or 0.86% at 24,039.35. The BSE Sensex also reversed course after a mild positive start, dropping 588.90 points or 0.74% to close at 79,212.53.
Nifty Bank didn’t escape the pressure either, ending 537.35 points (0.97%) lower at 54,664.05. Financial and banking stocks remained under pressure as uncertainty gripped the market.
Also read: AU Small Finance is in repair mode, but NIM could be a challenge
Sector-wise, the market saw no gainers. Realty stocks led the decline with a 2.80% drop, followed by PSE stocks (down 2.56%) and healthcare (down 2.42%), reflecting risk-off sentiment across the board.
Among stocks, SBI Life stood out as a rare positive, gaining 5.40% on a strong earnings outlook. TCS edged up 1.36%, while Tech Mahindra added 1.16% thanks to resilience in IT and rural demand-driven sentiment.
On the flip side, Shriram Finance plunged 5.95% after a weak quarterly performance. Adani Enterprises fell 3.61% and Adani Ports declined 3.51% as profit-booking intensified.
Market update: Nifty daily and hourly analysis
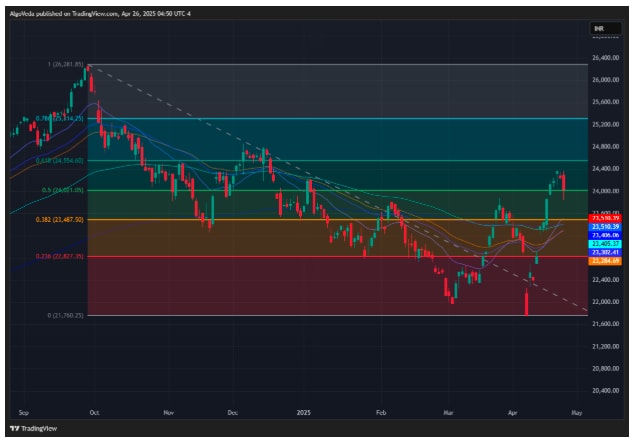
On the daily chart, Friday saw a big red candle after touching a low of 21,735, indicating some profit booking. The key support level is at 24,000. If the market breaks below this, we may see further selling pressure.
The next fresh buying opportunity will come once we close above 24,530, which is the 61.8% retracement level between the lifetime high of 26,257 and the recent low of 21,735.

View Full Image
Also read: Bajaj Housing ends FY25 on a strong note, but the stock remains richly valued
On the hourly chart, we have one big red candle, indicating selling pressure during the first half of Friday. The point of control (POC) area is at 23,842, which may act as a support. If we slip below this level, we may see further selling pressure.

View Full Image
On the upside, fresh buying will only come if there is a close above 24,282 (futures levels). The RSI is at 48 and trending downward, indicating selling pressure in the market. Also, MACD has given a sell signal.
Ankush Bajaj is a Sebi-registered research analyst. His registration number is INH000010441.
Investments in securities are subject to market risks. Read all the related documents carefully before investing.
Registration granted by Sebi and certification from NISM in no way guarantee performance of the intermediary or provide any assurance of returns to investors.
Disclaimer: The views and recommendations given in this article are those of individual analysts. These do not represent the views of Mint. We advise investors to check with certified experts before making any investment decisions.