Gold (XAU/USD) maintains its offered tone through the first half of the European session on Monday and currently trades just below the $4,300 mark – the lowest since March 23. Renewed hostilities in the Gulf push Crude Oil prices higher, fueling inflationary concerns and bolstering bets for more hawkish central banks. This, in turn, is seen as a key factor undermining demand for the non-yielding bullion. The downfall validates Friday’s breakdown below a technically significant 200-day Simple Moving Average (SMA), setting the stage for an extension of a nearly two-month-old downtrend.
The Israel-Iran conflict has entered a dangerous new phase, with both sides exchanging attacks across multiple fronts. Israel said that it carried out fresh strikes on military targets in western and central Iran after the latter fired waves of ballistic missiles at Israel’s Ramat David air base on Sunday night. The tensions have spilled beyond the two countries, with reports of Israeli strikes in southern Lebanon and Iranian military action in northern Iraq, raising fears of a wider regional conflict. The developments threaten a fragile ceasefire and temper hopes for a deal to end a three-month-old war, assisting the safe-haven US Dollar (USD) to preserve its recent strong gains to a two-month high.
Adding to this, the upbeat US Nonfarm Payrolls (NFP) report released on Friday reaffirmed bets that the US Federal Reserve (Fed) will keep interest rates higher for longer. In fact, the US jobs data showed that the economy added 172K new jobs in May, compared to 85K estimated and the previous month’s upwardly revised reading of 179K. Additional details revealed that the Unemployment Rate held steady at 4.3%, as anticipated, offsetting the widely expected slowdown in Average Hourly Earnings growth to the 3.4% YoY rate from 3.6% in April. Traders were quick to react and are now pricing in over a 70% chance that the Fed will raise borrowing costs by the end of this year.
The outlook, in turn, is seen as another factor acting as a tailwind for the Greenback, suggesting that the path of least resistance for the Gold price remains to the downside. Moving ahead, there isn’t any relevant market-moving economic data due for release from the US on Monday, leaving the USD and the precious metal at the mercy of incoming geopolitical headlines. Later this week, traders will take cues from the US inflation figures – the Consumer Price Index (CPI) and the Producer Price Index (PPI) on Wednesday and Thursday, respectively. Apart from this, the Bank of Canada (BoC) rate decision and the European Central Bank (ECB) meeting should infuse volatility in the financial markets.
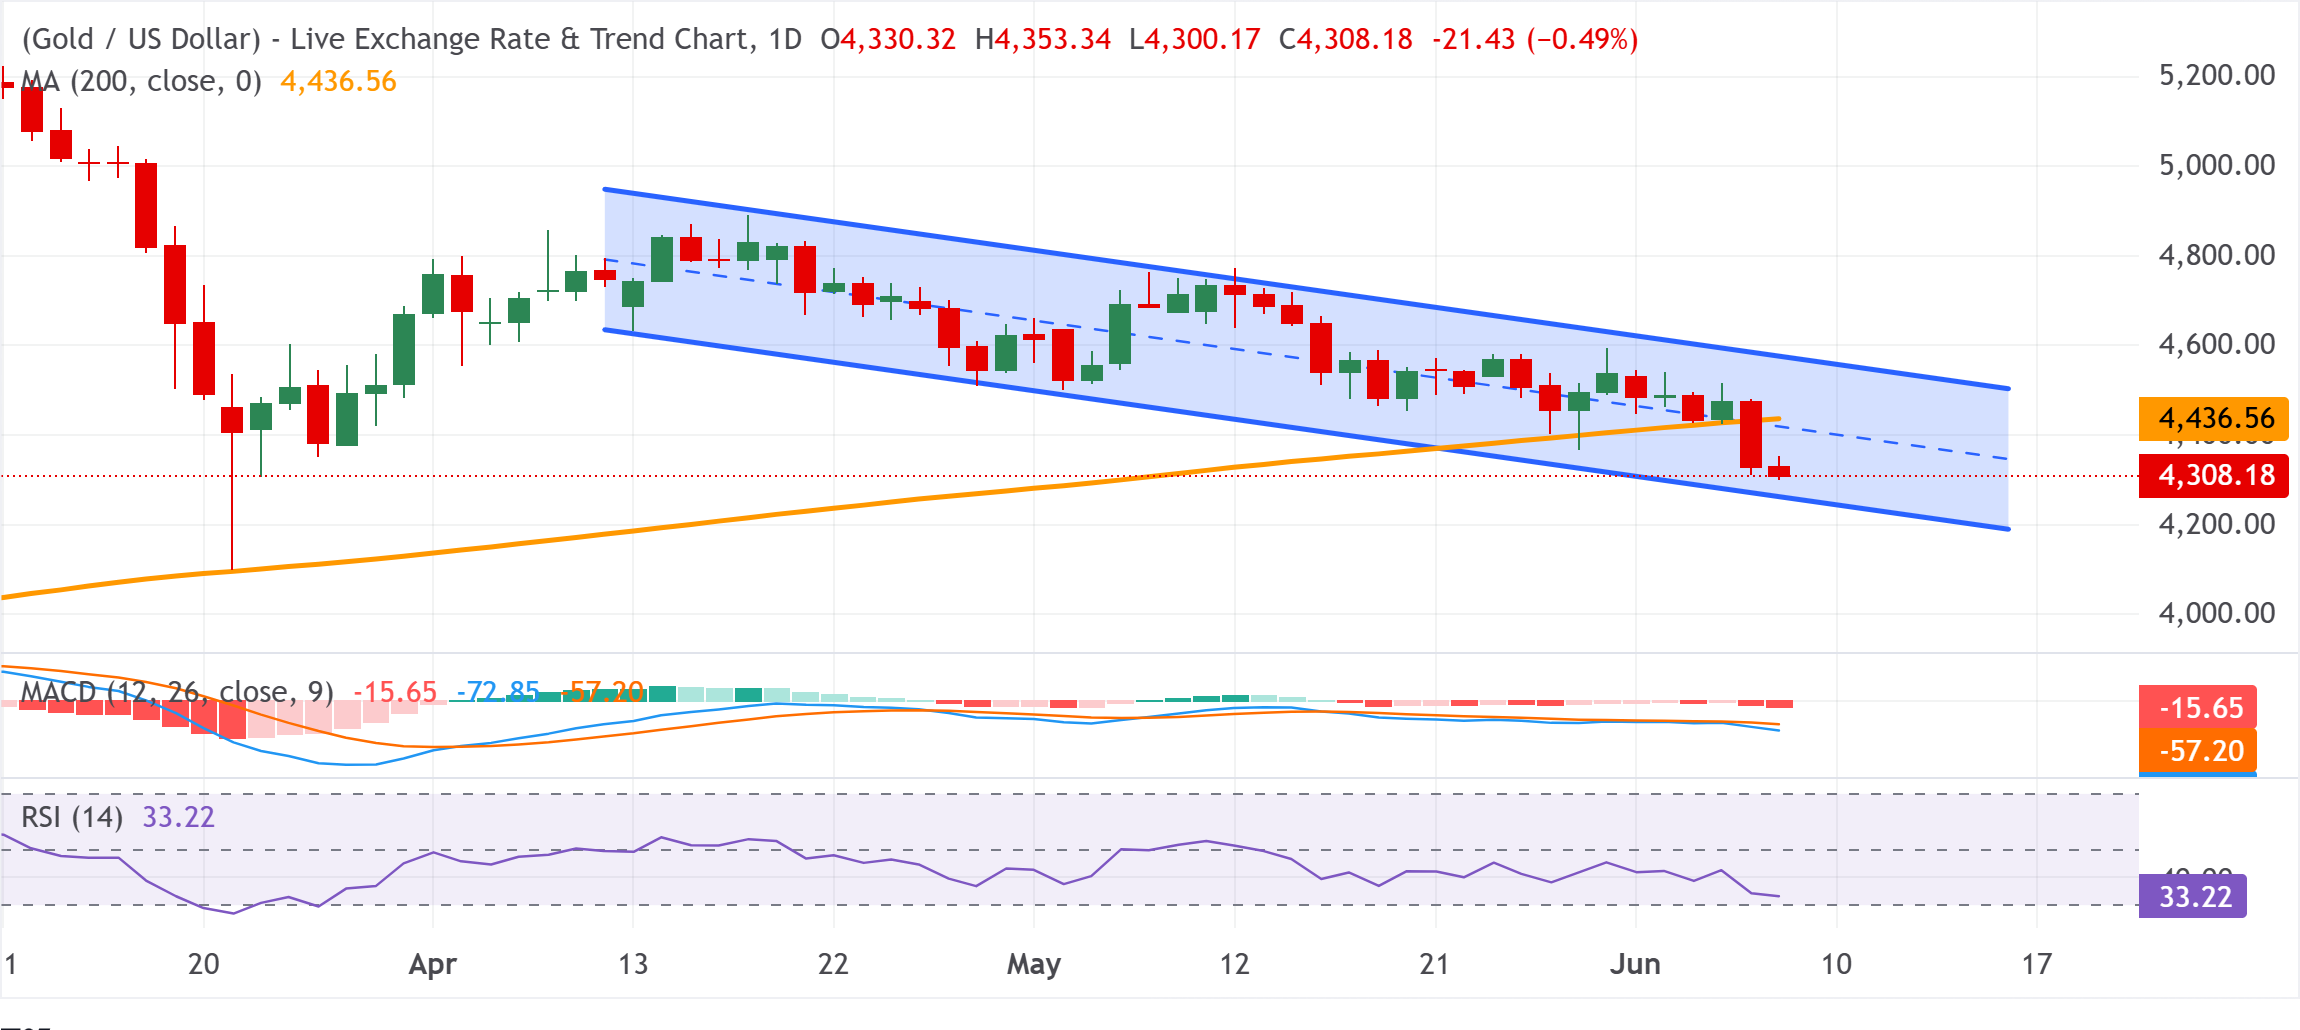
XAU/USD daily chart
Gold bears have the upper hand while below 200-day SMA and $4,300 break points
The XAU/USD pair keeps a bearish bias inside a downward parallel channel and below the 200-day SMA. Adding to this, the Moving Average Convergence Divergence (MACD) indicator sits in negative territory with a widening bearish profile. Meanwhile, the Relative Strength Index (RSI) around 33 suggests persistent downside pressure, though nearing oversold conditions that could slow immediate follow-through.
On the topside, initial resistance is located at the 200-day SMA at $4,436.56, with the channel’s upper boundary near $4,555.49 acting as a stronger cap while the broader downtrend persists. On the downside, the lower band of the descending channel around $4,242.07 offers initial support, and a clear break beneath this floor would open the door to a deeper corrective leg within the prevailing bearish structure.
(The technical analysis of this story was written with the help of an AI tool.)
US Dollar Price Last 30 days
The table below shows the percentage change of US Dollar (USD) against listed major currencies last 30 days. US Dollar was the strongest against the New Zealand Dollar.
| USD | EUR | GBP | JPY | CAD | AUD | NZD | CHF | |
|---|---|---|---|---|---|---|---|---|
| USD | 1.82% | 1.77% | 2.10% | 2.08% | 2.31% | 2.34% | 2.23% | |
| EUR | -1.82% | -0.08% | 0.30% | 0.27% | 0.41% | 0.50% | 0.40% | |
| GBP | -1.77% | 0.08% | 0.38% | 0.35% | 0.57% | 0.61% | 0.48% | |
| JPY | -2.10% | -0.30% | -0.38% | -0.03% | 0.05% | 0.18% | 0.16% | |
| CAD | -2.08% | -0.27% | -0.35% | 0.03% | 0.04% | 0.22% | 0.15% | |
| AUD | -2.31% | -0.41% | -0.57% | -0.05% | -0.04% | 0.14% | 0.00% | |
| NZD | -2.34% | -0.50% | -0.61% | -0.18% | -0.22% | -0.14% | -0.19% | |
| CHF | -2.23% | -0.40% | -0.48% | -0.16% | -0.15% | -0.01% | 0.19% |
The heat map shows percentage changes of major currencies against each other. The base currency is picked from the left column, while the quote currency is picked from the top row. For example, if you pick the US Dollar from the left column and move along the horizontal line to the Japanese Yen, the percentage change displayed in the box will represent USD (base)/JPY (quote).