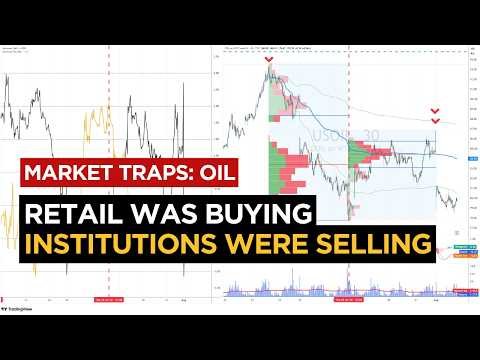
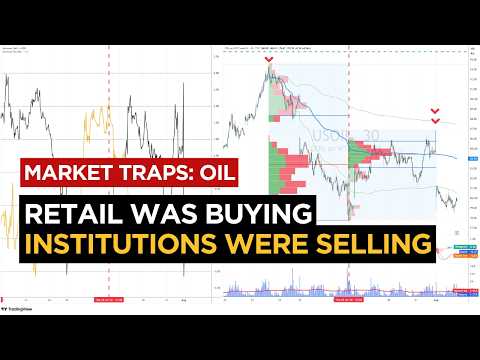
Oil was climbing. The Middle East conflict news pushed everyone to buy, and they seemed to be right — the price kept going up. But behind that move, institutional liquidity told the opposite story: while the retail world bought on the news, the Big Guy was selling. In this breakdown I show you how to detect that invisible liquidity by combining four tools: the liquidity line, Volume Profile, VWAP, and the Elliott Wave count.
The problem price alone can’t solve
When you see price rising, you know one thing for certain: there are market orders buying. Retail is buying. But that doesn’t answer the question that actually matters: who’s on the other side?
Because for every buyer there’s a seller. And the decisive question is whether that counterparty is simply facilitating the move — letting price rise — or accumulating positions against it, preparing the reversal. With price alone, it’s impossible to tell.
That’s where the liquidity line comes in. On the chart, while price (the black line) rose, the institutional liquidity line (orange) fell, and the difference between them widened. That divergence is the signature of institutional intent: retail buys the news, but the Big Guy sells. The real direction is bearish.
The first question of every trade
There’s something I always tell my clients: the first question when looking for a trade isn’t “where do I enter?” but “which trade can I NOT take?”
There are only three possible actions in trading: buy, sell, or wait. When liquidity shows the institutional intent is bearish, buying is immediately ruled out. That elimination alone is a victory — it keeps you from falling into the trap of buying alongside the retail crowd that’s going to lose. Once buying is removed, two options remain: sell or wait. And that clarity is enormous, because it lets you focus your entire analysis on one side of the market.
The distance rule
Here’s a liquidity rule worth committing to memory: you need a considerable distance between price and the liquidity line to have an edge.
When price and liquidity are together — when they intersect — there’s no edge. The market is at equilibrium and trading there is gambling. But when the difference between them is wide, there’s a gap the market tends to close, and that gap is the opportunity. In the oil example, when price fell and reached the liquidity line — when the two came together — that was the signal to book profits on the sell and start watching for the buy.
Volume Profile: the levels, not the direction
Here’s one of the most important concepts in the video, and one that corrects a mistake almost everyone makes while learning.
Volume Profile isn’t a predictive tool. It shows where activity concentrated — the point of control, which is the statistical mode of the volume distribution — but it doesn’t tell you where price is going to go. That’s the mistake: using Volume Profile or VWAP to predict. The correct tool to know what comes next is liquidity, not volume.
So what is Volume Profile for? To mark the levels price will travel to. When volume exhausts in a zone — when the distribution shows exhaustion — that, combined with the liquidity signal, indicates with high probability that price will move toward the point of control. Volume Profile defines the destination; liquidity defines the direction.
VWAP: the fair price
The fourth tool is the VWAP (Volume Weighted Average Price), the volume average. On the chart it appears as a line representing the market’s fair price.
The concept is simple and powerful: when we trade, we look for unfair prices that tend to return to fair value. If price moves too far from the VWAP — it’s “expensive” or “cheap” relative to fair value — there’s a high probability it returns. The VWAP gives you that equilibrium reference point, and combined with liquidity and Volume Profile, it completes the map.
The same volume, opposite meanings
This is the nuance that separates the experienced operator from the beginner. The same volume pattern can mean opposite things.
There can be volume concentration at the highs and price rises. Or volume concentration at the highs and price falls. Volume Profile alone doesn’t distinguish between the two cases. What distinguishes them? Knowing who’s behind that volume. If the institutions are buying that liquidity, price continues. If the institutions are selling while retail buys, price falls. And the only way to know who’s behind it is the liquidity line.
Since 90% of retail loses, that means in 90% of cases the institution wins. Positioning yourself on the institution’s side isn’t an opinion — it’s reading liquidity and getting on the right side of the statistics.
The outcome: the stop hunt
The oil example closes with a powerful lesson. Everyone who bought, trapped by the conflict news, was positioned long. When the market opened Sunday, price fell with a gap, took out all the stops of that group, and stripped their liquidity. Over the weekend, the conflict situation resolved — impossible to anticipate from news alone, but something liquidity had been signaling days earlier.
The lesson: avoiding the long side was the first benefit. Being on the correct short side was the second. Both came from reading liquidity, not the news.
The core idea
None of these four tools works alone. Liquidity gives the direction, Volume Profile gives the levels, VWAP gives the fair price, and Elliott Wave places the cycle. Together, they turn a chaotic market like oil in the middle of a geopolitical crisis into a readable scenario. And most importantly: they let you understand what’s happening behind the scenes, which side the institutions are on, instead of reacting to the news like the retail crowd that loses.
This is the kind of analysis we apply every day in our trading room, combining Elliott Wave, liquidity, Volume Profile, VWAP, and Wyckoff techniques.
About The Author