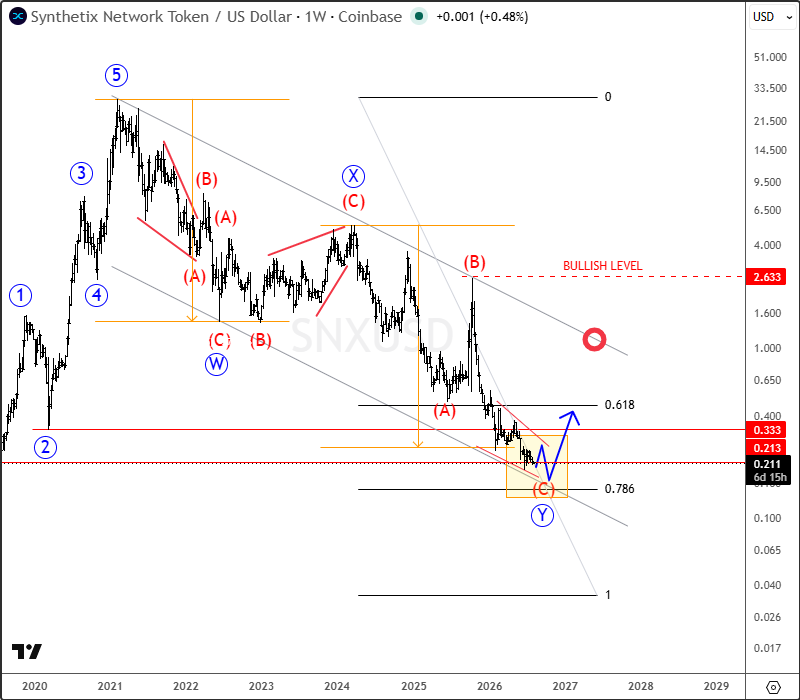
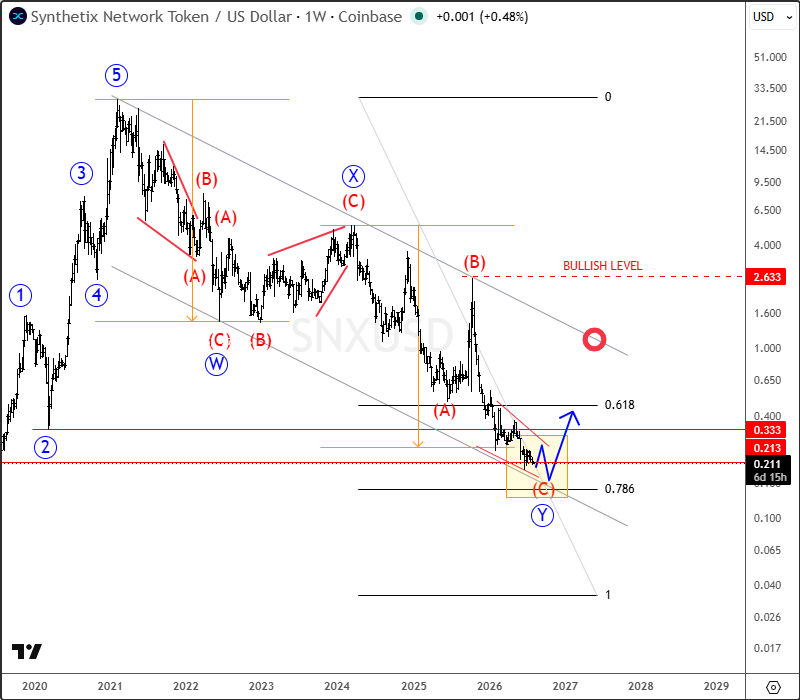
Synthetix (SNXUSD) could still be completing the final subwave (C) of wave Y within a larger and more complex W-X-Y corrective decline on the weekly chart. The current 0.20–0.15 support zone, near the 78.6% Fibonacci retracement, could act as a potential reversal area. Price is currently testing the lower channel support, while wave Y has reached a level where it equals wave W. However, support is not confirmed yet, and it could take even more time. We would need to see a sharp impulsive recovery back above the channel resistance near the 1.0 level to suggest that a bottom may be forming. Stronger bullish confirmation comes only above the 2.6 area.
Get Full Access To Our Premium Elliott Wave Analysis For 14 Days. Click here.
About The Author