Ripple (XRP) edges lower toward the short-term $1.05 psychological support level at the time of writing on Wednesday. This marks three consecutive days of losses, undermining investor interest and the broader optimism for a potential deal between the United States (US) and Iran to reopen the Strait of Hormuz.
XRP demand softens as headwinds escalate
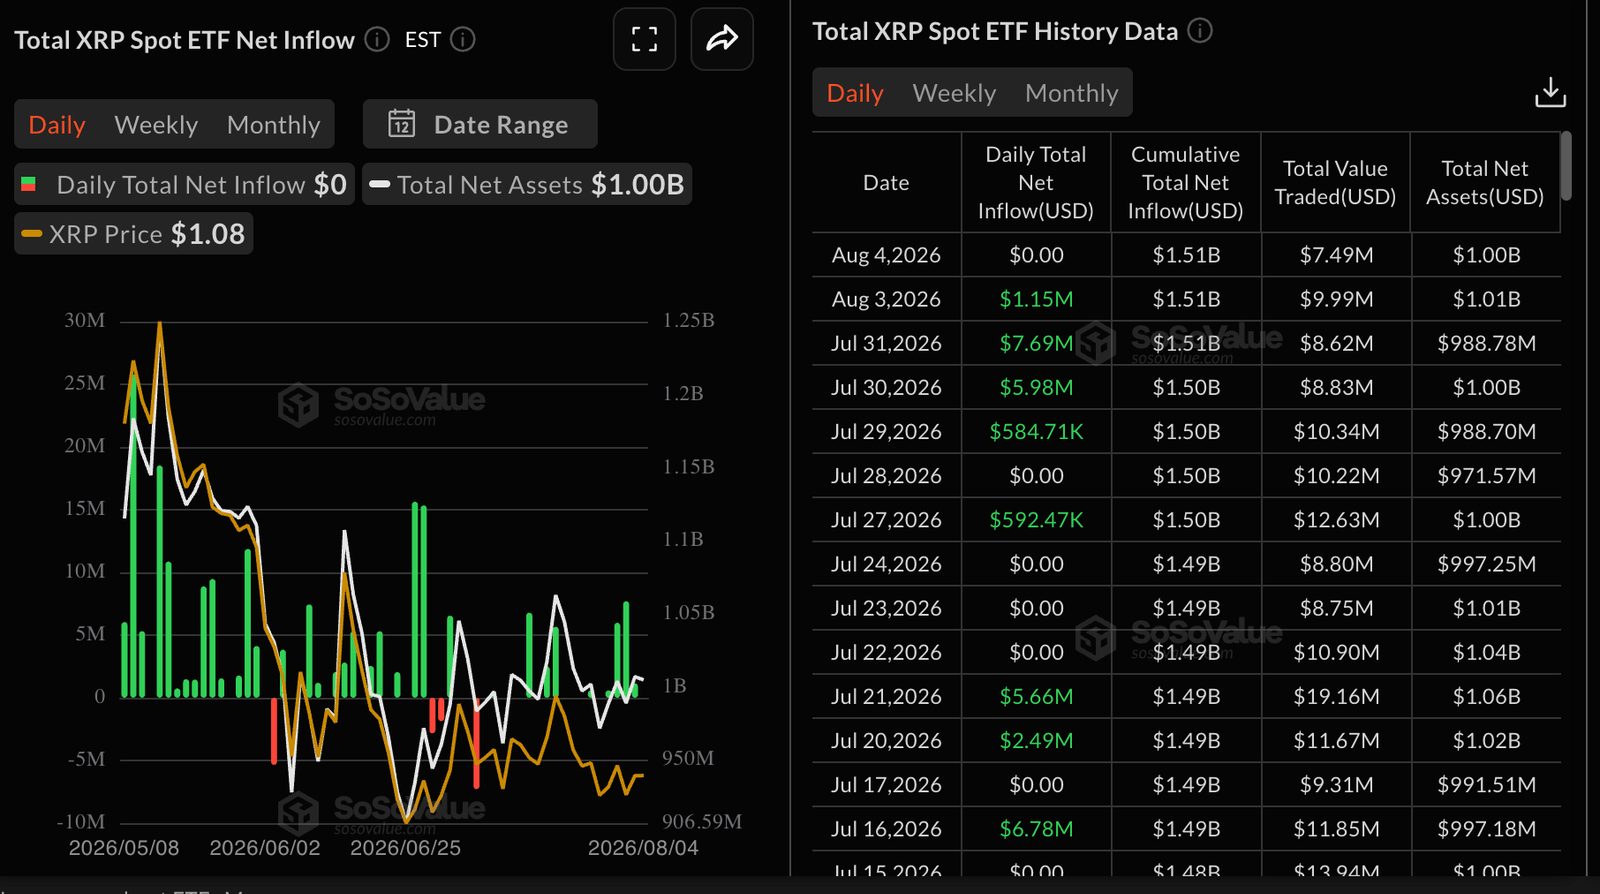
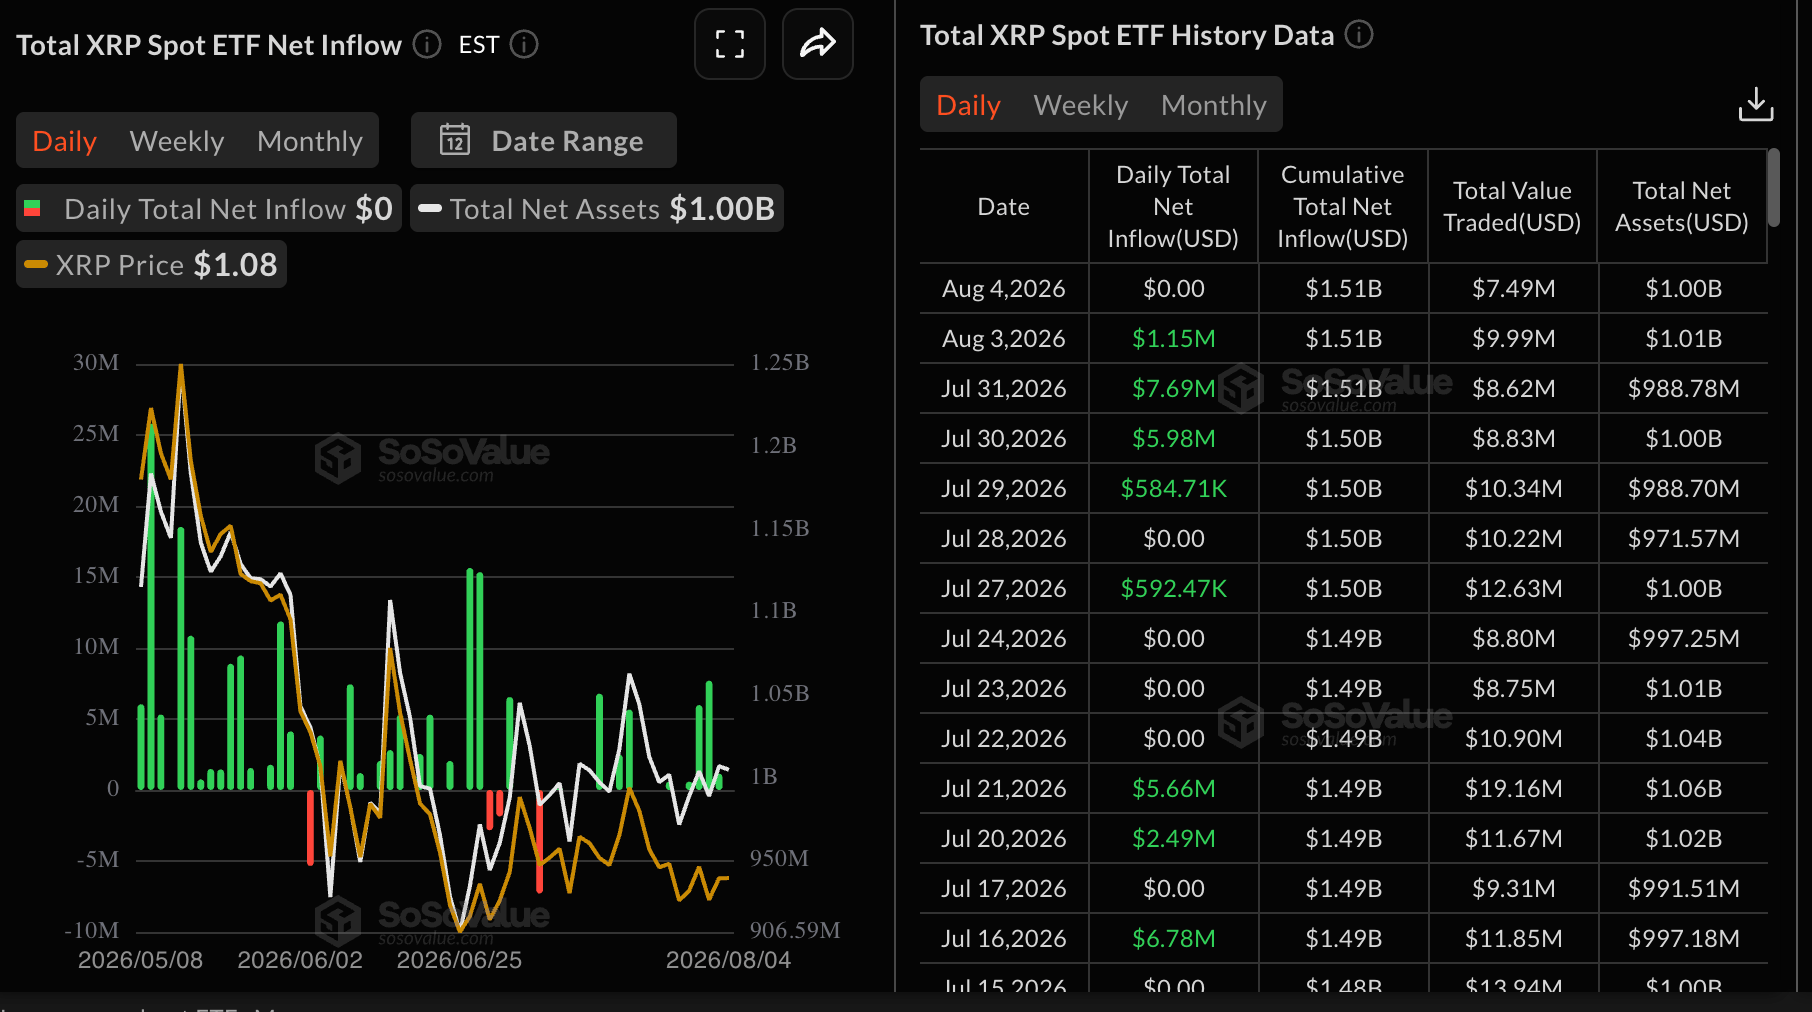
Institutional interest in XRP Exchange-Traded Funds (ETFs) remains on the back foot, given muted activity on Tuesday and mild inflows of $1.15 million on Monday. According to SoSoValue, cumulative inflows are holding steady at $1.51 billion and total assets under management at $1.00 billion, indicating that investors have retained a positive long-term outlook in the token.
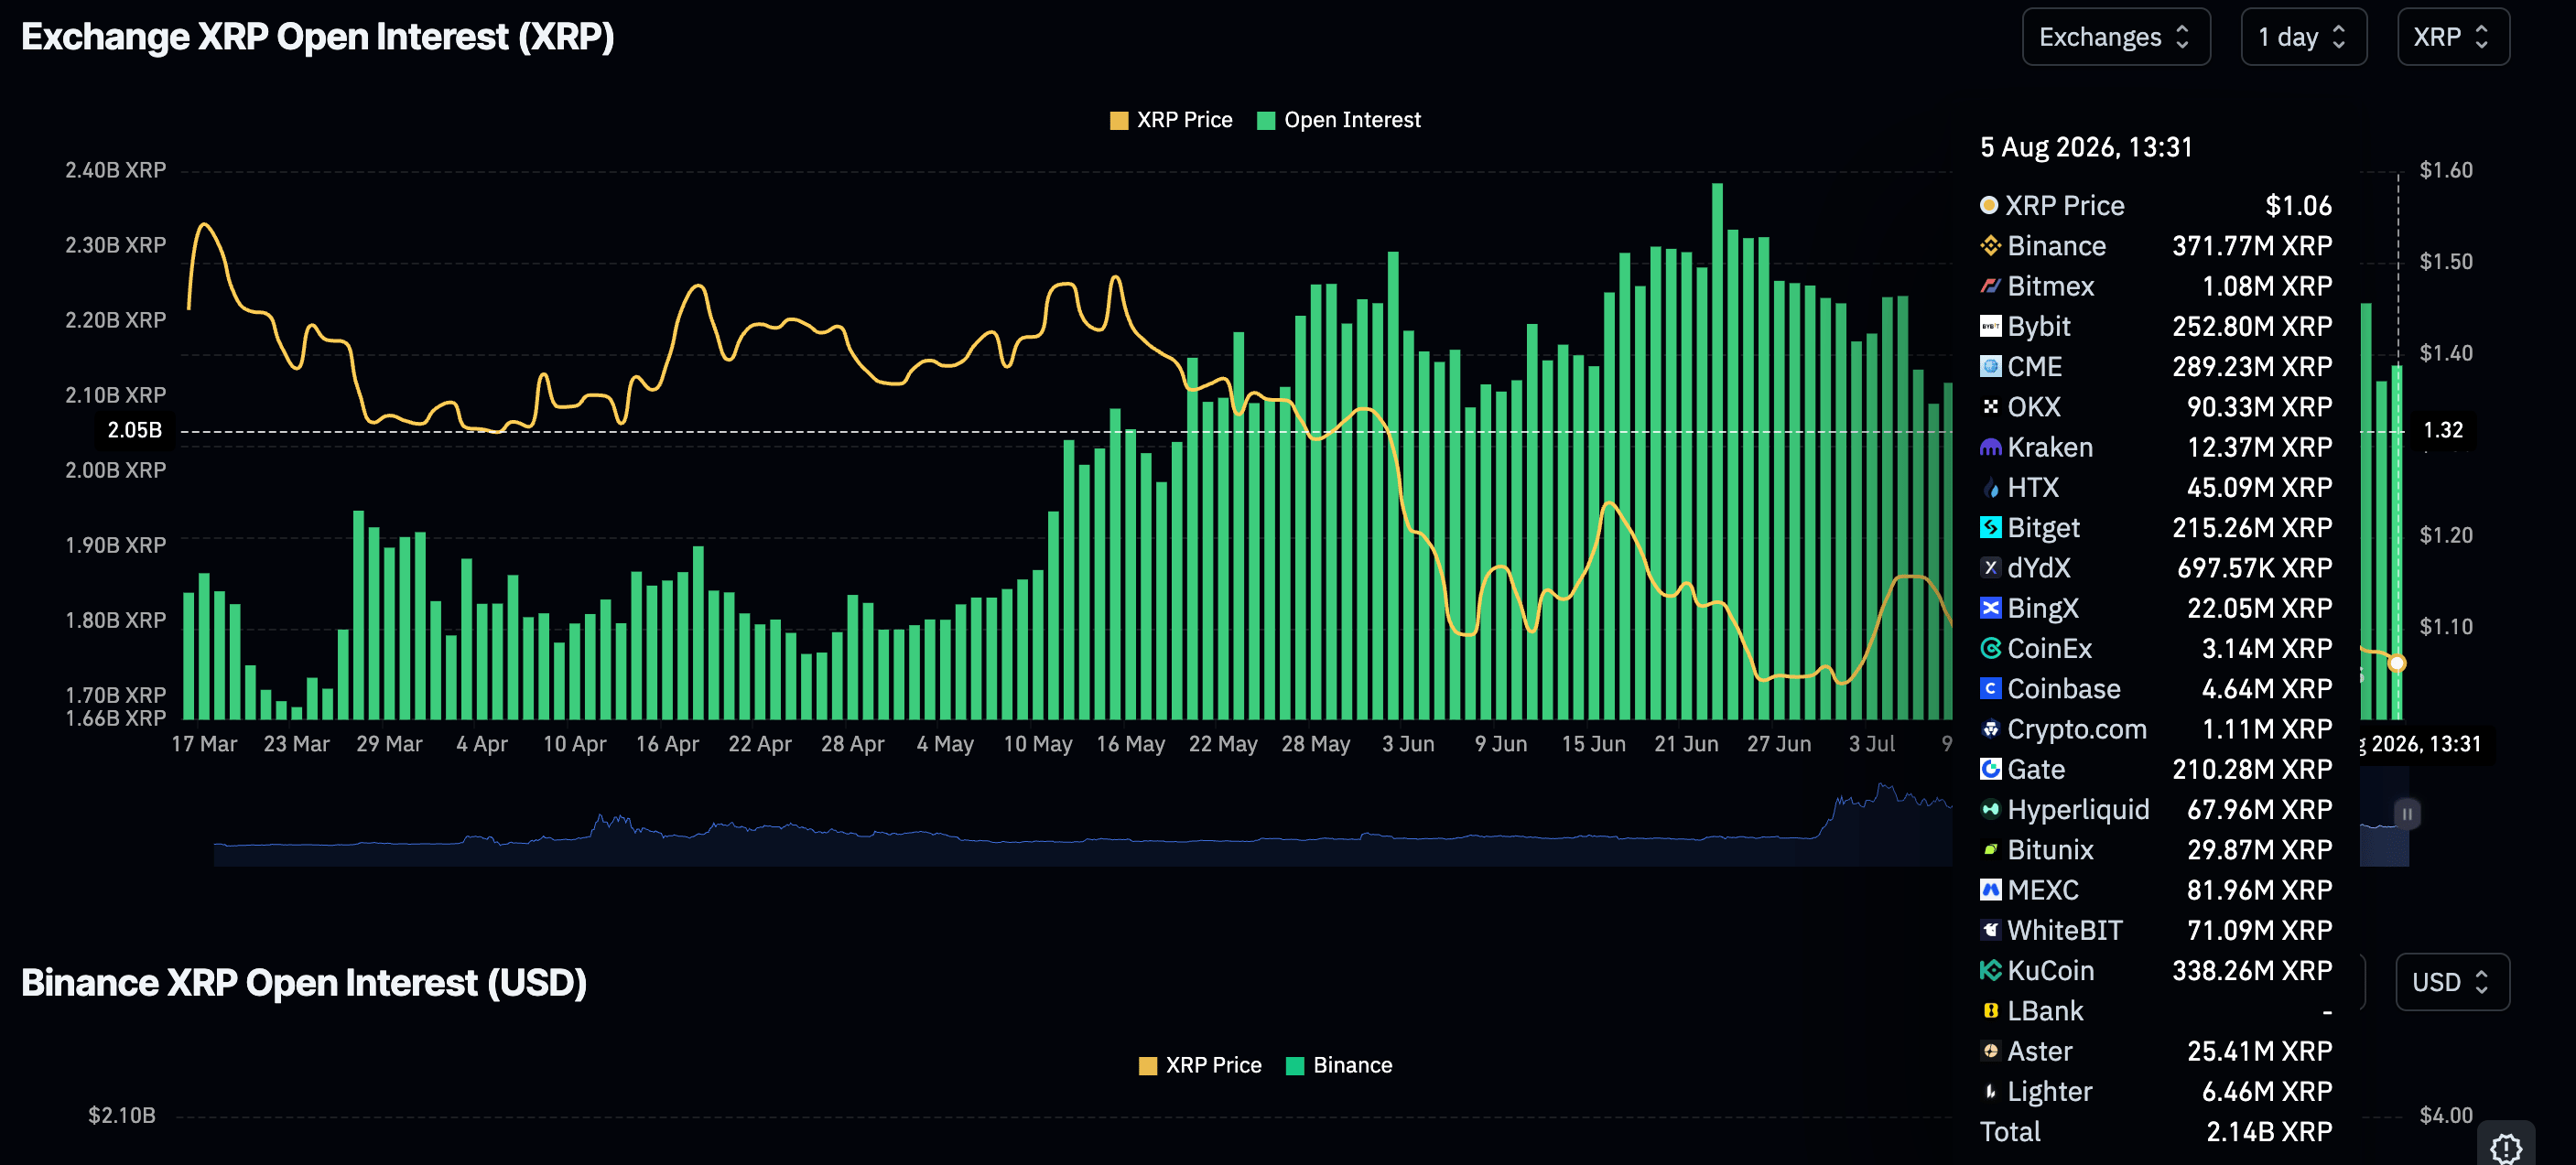
Retail demand has improved only slightly to 2.14 XRP on Wednesday, from 2.12XRP the previous day, according to CoinGlass’s data on perpetual futures Open Interest (OI). Despite the increase, the chart below highlights a general downtrend from 2.37 billion XRP, which marked the peak in July.
In other news, Ripple announced a strategic investment in ZILO, a platform that specializes in transfer technology solutions for asset managers, and Liquid, a tokenization and trading company specializing in digital ownership and asset liquidity.
Nigel Khakoo, Senior Vice President, Trading and Markets at Ripple, said in a press release on Monday that “ZILO and Licuido provide core capabilities that are essential to further scaling this shift: regulated digital transfer agency infrastructure and liquidity for issuance and collateral mobility.”
Technical analysis: XRP bears tighten grip amid persistent declines
XRP remains under clear downside pressure, holding below the 50-day, 100-day and 200-day Exponential Moving Averages (EMAs), which all sit well overhead and reinforce a bearish near-term bias. The downtrend resistance trendline, with a break level around $1.08, also stays above spot, suggesting that even modest rebounds would face selling interest.
Momentum indicators align with this tone, as the Relative Strength Index (RSI) slips in the low-40s on the daily chart and the Moving Average Convergence Divergence (MACD) histogram is marginally negative, hinting that bearish momentum is present but not yet exhausted.
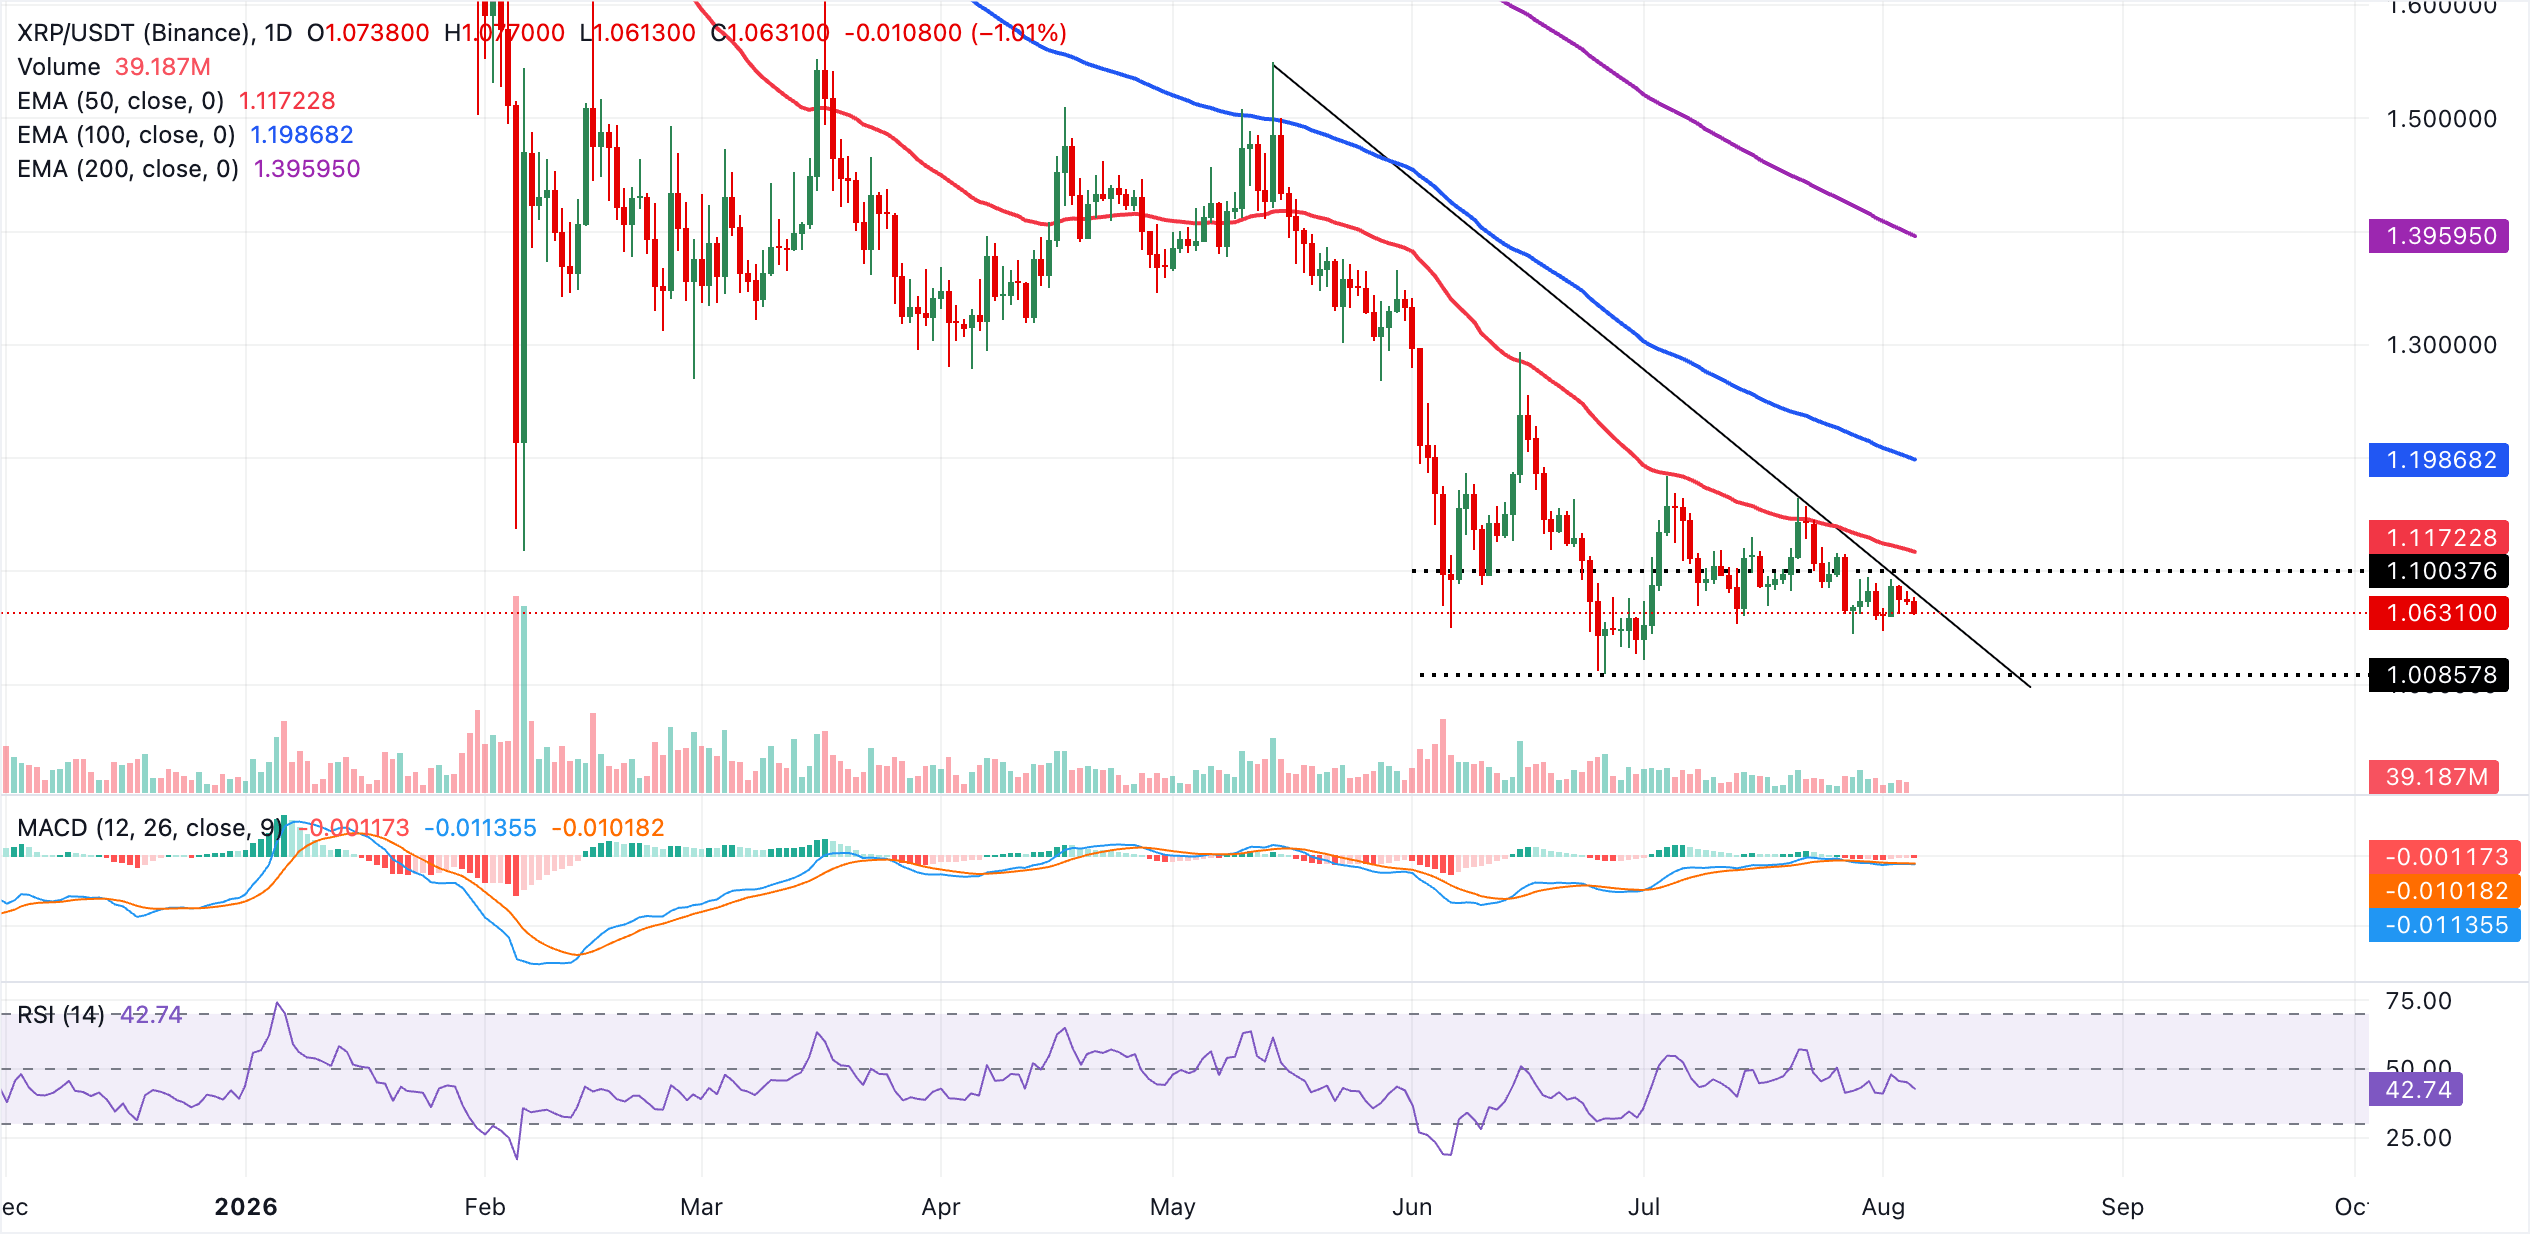
Initial resistance lies at the downtrend resistance break area near $1.08, where failure to reclaim would keep the latest slide intact. Above that zone, the 50-day EMA around $1.12 is the next hurdle, followed by the 100-day EMA near $1.20, while the 200-day EMA up at $1.40 defines a much higher structural cap that would need to be overcome to meaningfully challenge the broader bearish structure. On the flip side, the path of least resistance remains to the downside with the area at $1.05 holding as the nearest support, followed by the critical $1.00 level.
(The technical analysis of this story was written with the help of an AI tool. Know more.)
Bitcoin, altcoins, stablecoins FAQs
Bitcoin is the largest cryptocurrency by market capitalization, a virtual currency designed to serve as money. This form of payment cannot be controlled by any one person, group, or entity, which eliminates the need for third-party participation during financial transactions.
Altcoins are any cryptocurrency apart from Bitcoin, but some also regard Ethereum as a non-altcoin because it is from these two cryptocurrencies that forking happens. If this is true, then Litecoin is the first altcoin, forked from the Bitcoin protocol and, therefore, an “improved” version of it.
Stablecoins are cryptocurrencies designed to have a stable price, with their value backed by a reserve of the asset it represents. To achieve this, the value of any one stablecoin is pegged to a commodity or financial instrument, such as the US Dollar (USD), with its supply regulated by an algorithm or demand. The main goal of stablecoins is to provide an on/off-ramp for investors willing to trade and invest in cryptocurrencies. Stablecoins also allow investors to store value since cryptocurrencies, in general, are subject to volatility.
Bitcoin dominance is the ratio of Bitcoin’s market capitalization to the total market capitalization of all cryptocurrencies combined. It provides a clear picture of Bitcoin’s interest among investors. A high BTC dominance typically happens before and during a bull run, in which investors resort to investing in relatively stable and high market capitalization cryptocurrency like Bitcoin. A drop in BTC dominance usually means that investors are moving their capital and/or profits to altcoins in a quest for higher returns, which usually triggers an explosion of altcoin rallies.
About The Author