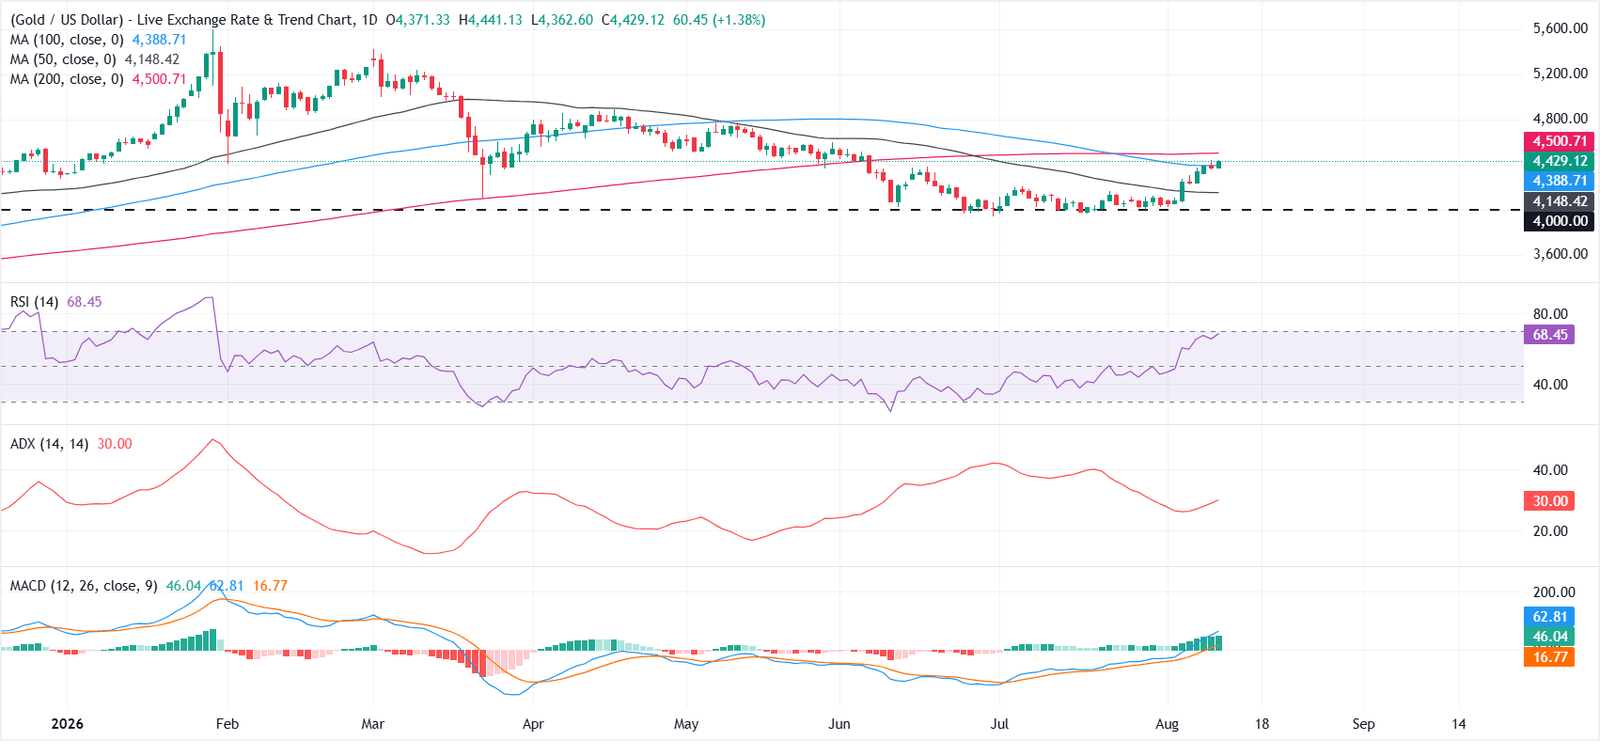
Gold (XAU/USD) extends gains above $4,400 on Wednesday as traders digest US inflation data, which came broadly in line with expectations. At the time of writing, XAU/USD trades around $4,429, up 1.38% on the day.
Headline Consumer Price Index (CPI) rose 0.1% in July after falling 0.4% in June, while the annual rate eased to 3.4% from 3.5%. CPI increased 0.2% MoM after staying flat, with the yearly rate slowing to 2.5% from 2.6%.
Following the data, the US Dollar (USD) and US Treasury yields came under pressure, supporting the precious metal. The US Dollar Index (DXY), which tracks the Greenback against a basket of six major currencies, trades around 99.70, down 0.10% on the day. Treasury yields fell across the curve, with the 2-year yield down four basis points from the daily open and currently trading around 4.180%.
With inflation still above the Federal Reserve’s (Fed) 2% target and higher Oil prices adding to upside risks, the CPI report did little to change expectations that the Fed will keep monetary policy restrictive. However, the probability of a September rate hike fell to around 38% from 44% before the release, according to the CME FedWatch Tool.
Gold upside builds as Fed hike expectations fade and stagflation theme gains traction
According to TD Securities, “precious metals maintain upside” as the latest US CPI release “did little to reignite the Fed hike pricing,” with recent price action underscoring that “the gold market is increasingly not expecting hikes.” The bank notes that “for now, macro discretionary funds, ETF flows, and central bank demand have all materially picked up in the aftermath of the FOMC and have been emboldened after recent weakness in economic data.” TD Securities adds that “with the yellow metal rallying alongside renewed upside in energy prices, and so long as Fed Chair Warsh is expected to look through higher energy prices, the stagflationary theme will continue to pick up steam.”
Technical analysis: XAU/USD approaches the 200-day SMA
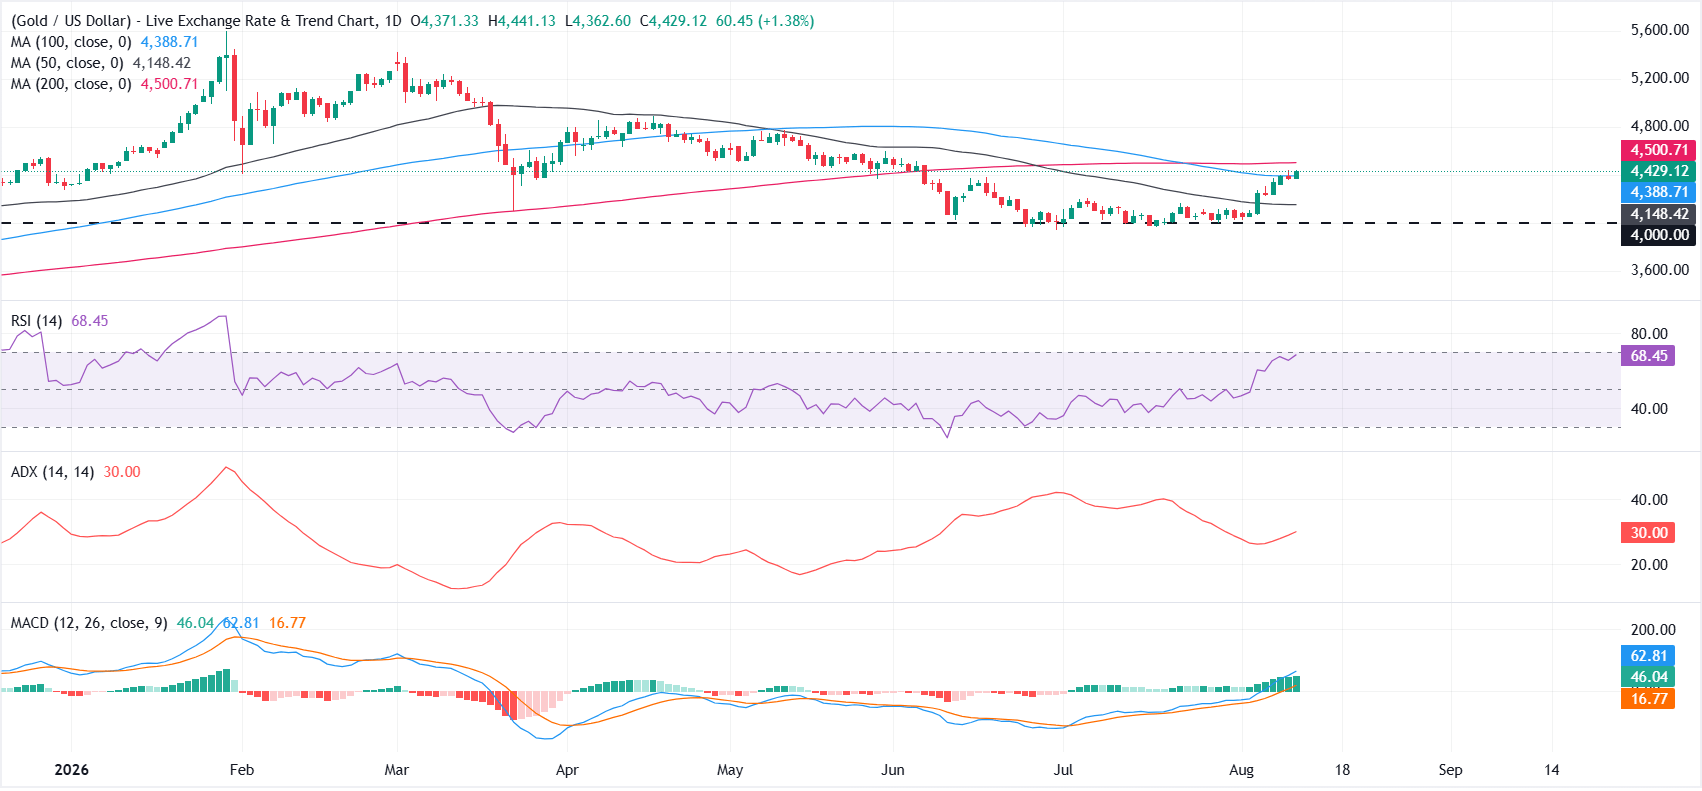
XAU/USD extends its advance above the 50-day Simple Moving Average (SMA) and trades just above the 100-day SMA, keeping the near-term bias bullish.
The pair is now approaching the 200-day SMA at $4,500, which acts as the next significant overhead barrier, while the Relative Strength Index (RSI) at 68 flirts with overbought territory, hinting that the latest advance is strong but could be prone to consolidation.
The Average Directional Index (ADX) at 30 points to a moderately directional market, reinforcing the idea of a sustained bullish phase as long as price remains above the short- and medium-term averages.
On the downside, immediate support is seen at the 100-day SMA near $4,388, with a deeper cushion at the 50-day SMA around $4,148, where buyers would be expected to re-emerge on corrective pullbacks. Further below, a more structural floor is located at the horizontal support line at $4,000.
On the topside, the 200-day SMA at $4,500 is the key resistance level that bulls need to reclaim to extend the uptrend, and a failure to clear this barrier would likely keep price consolidating above the nearby moving-average support band.
(The technical analysis of this story was written with the help of an AI tool. Know more.)
About The Author