Ripple (XRP) bulls are attempting a recovery above $1.36 at the time of writing on Thursday, underpinning a strong moving average support cluster. Despite the modest recovery, broader market sentiment remains shaky as investors adopt a cautious stance amid renewed tensions between the United States (US) and Iran.
The two nations re-escalated tensions last weekend, with strikes continuing early this week. Risk aversion is already evident, considering outflows from spot Exchange-Traded Funds (ETFs) on Wednesday.
XRP ETFs turn bearish amid growing investor caution
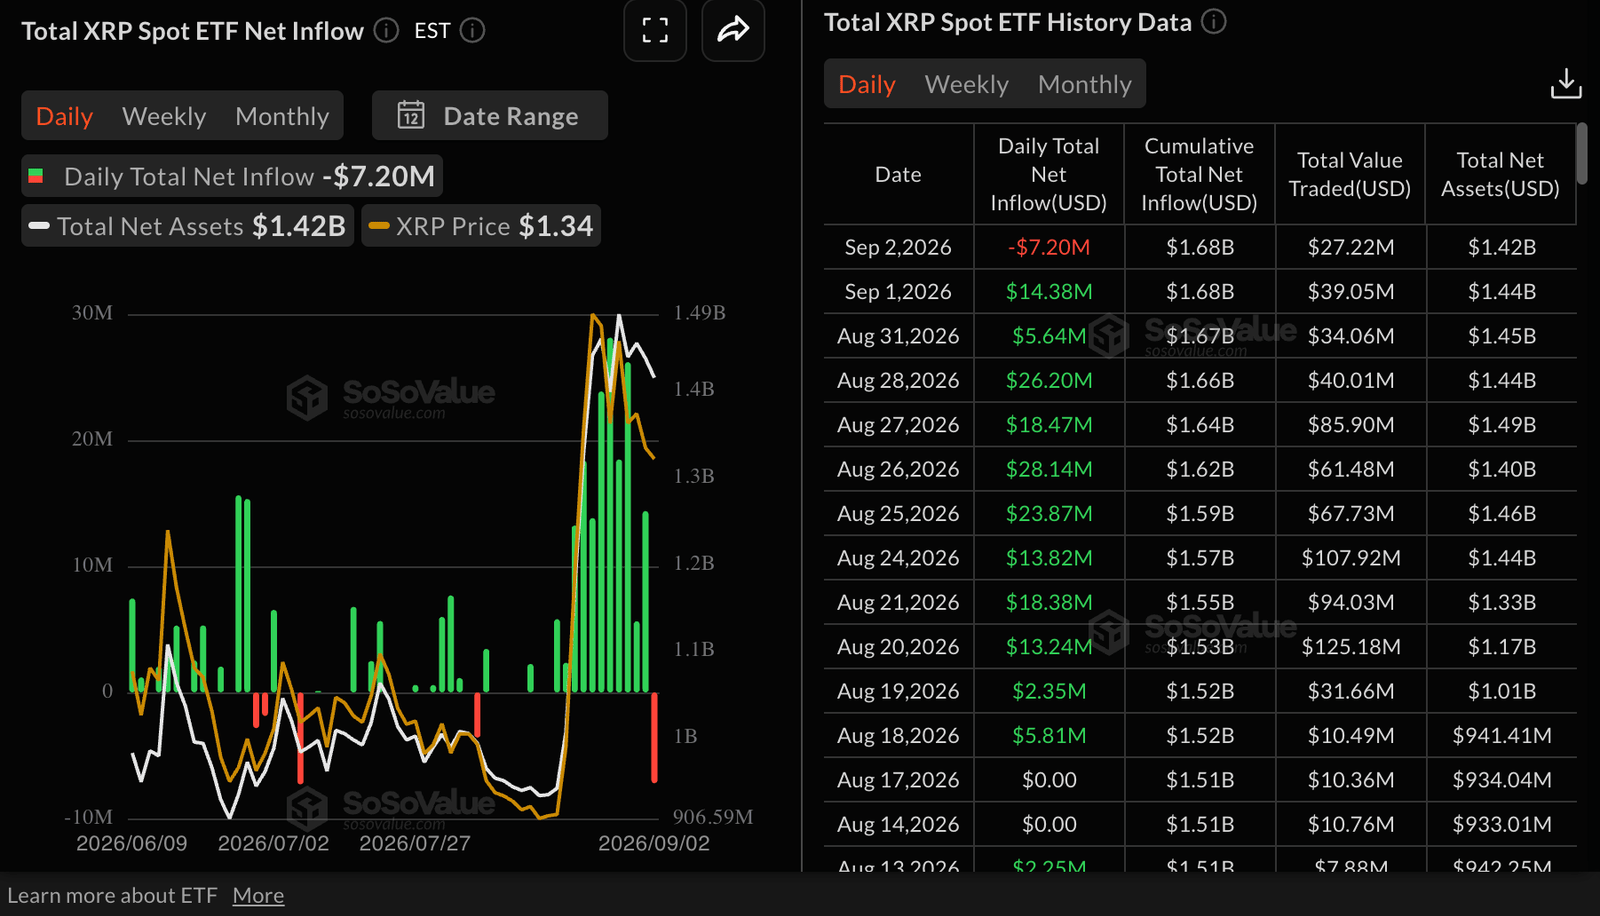
US-listed XRP spot ETFs saw outflows of $7 million on Wednesday, breaking an extended 11-day bullish streak. Despite the single-day outflow, cumulative inflows hold steady at $1.68 billion, up from $1.51 billion in early August, according to SoSoValue.
Similarly, total assets under management averaged $1.42 billion, up from $1 billion over the same period. If inflows return, they could cushion XRP from broader crypto headwinds, raising the chances of a sustained recovery above $1.40 and $1.50 levels, respectively.
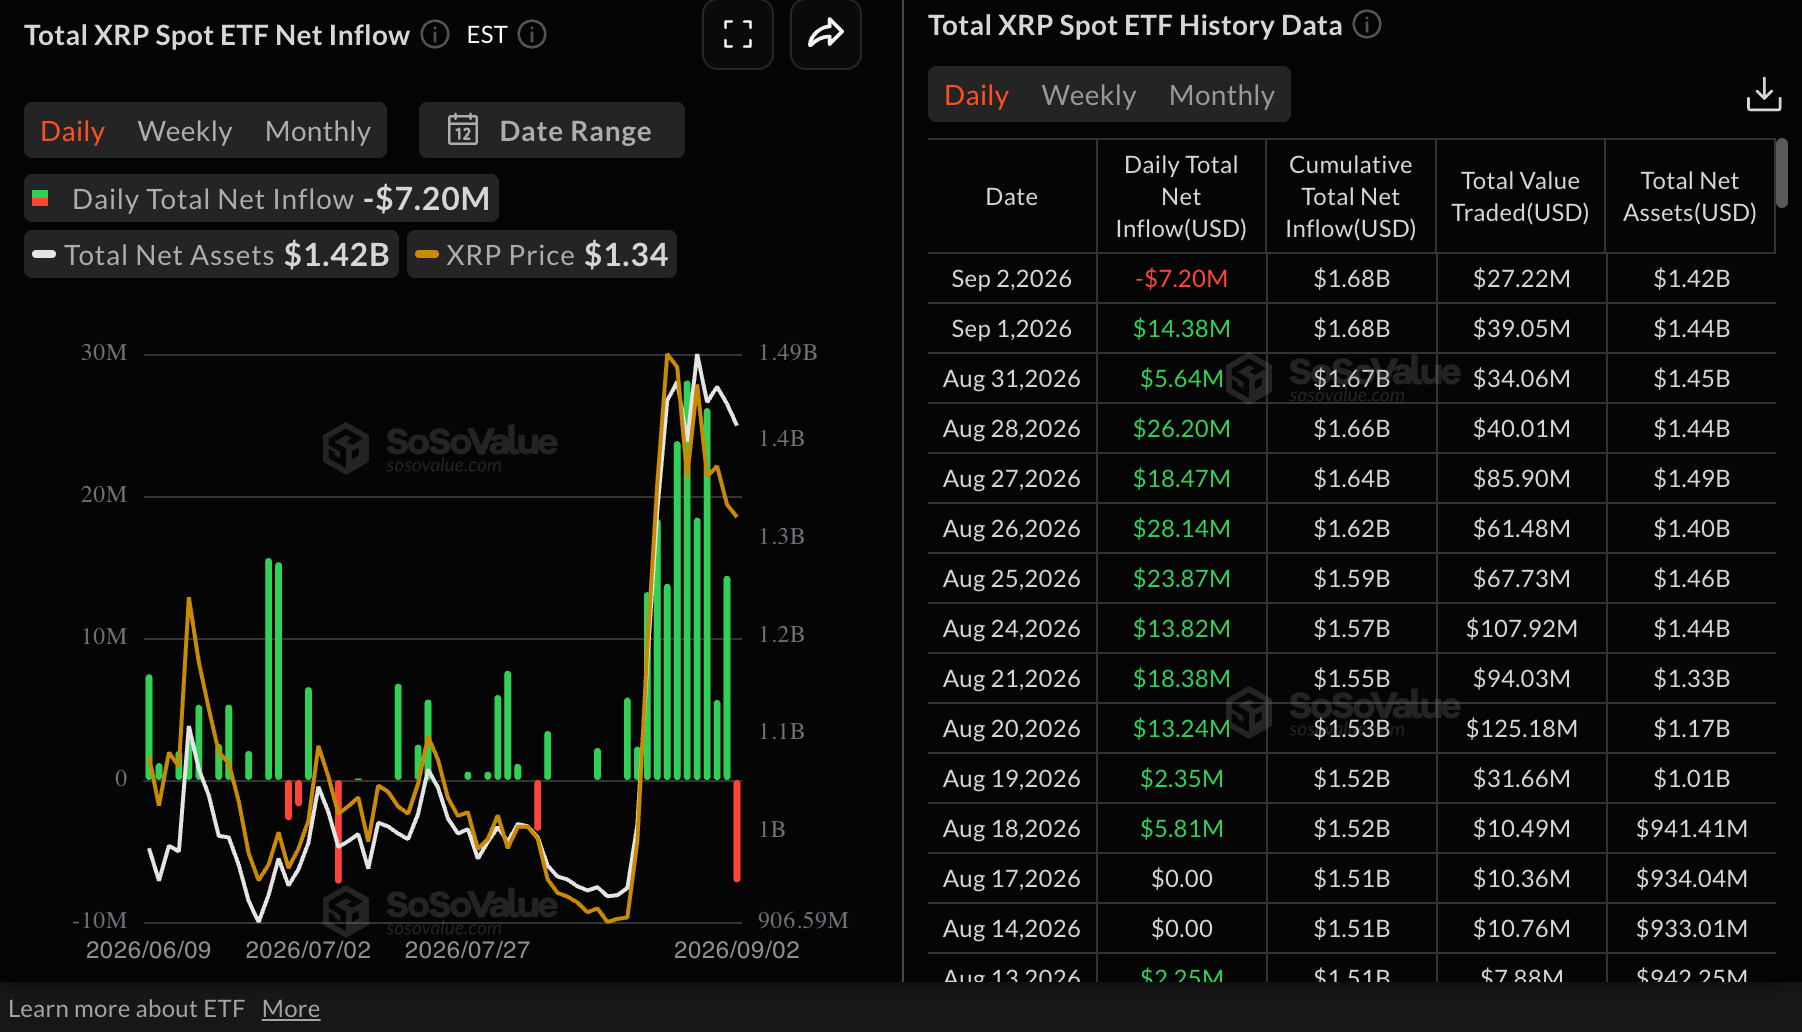
Meanwhile, retail demand remains steady, with perpetual futures Open Interest (OI) at 2.25 billion XRP on Thursday, down only marginally from 2.26 billion XRP the day before. CoinGlass data shows the decline against the backdrop of the OI spiking to 2.78 billion XRP on August 15. Retail interest in XRP is needed to support the short to medium-term recovery outlook.
Technical analysis: XRP shows subtle recovery signs
XRP trades above $1.36 while holding above a rising cluster of Exponential Moving Averages, with the 200-day EMA at $1.35 underpinning the latest breakout and the 50-day and 100-day EMAs at $1.22 and $1.22 reinforcing a constructive medium-term structure. Although the Moving Average Convergence Divergence (MACD) indicator slipped below its signal line and turned negative, the Relative Strength Index (RSI) near 60 suggests ongoing bullish bias rather than exhaustion.
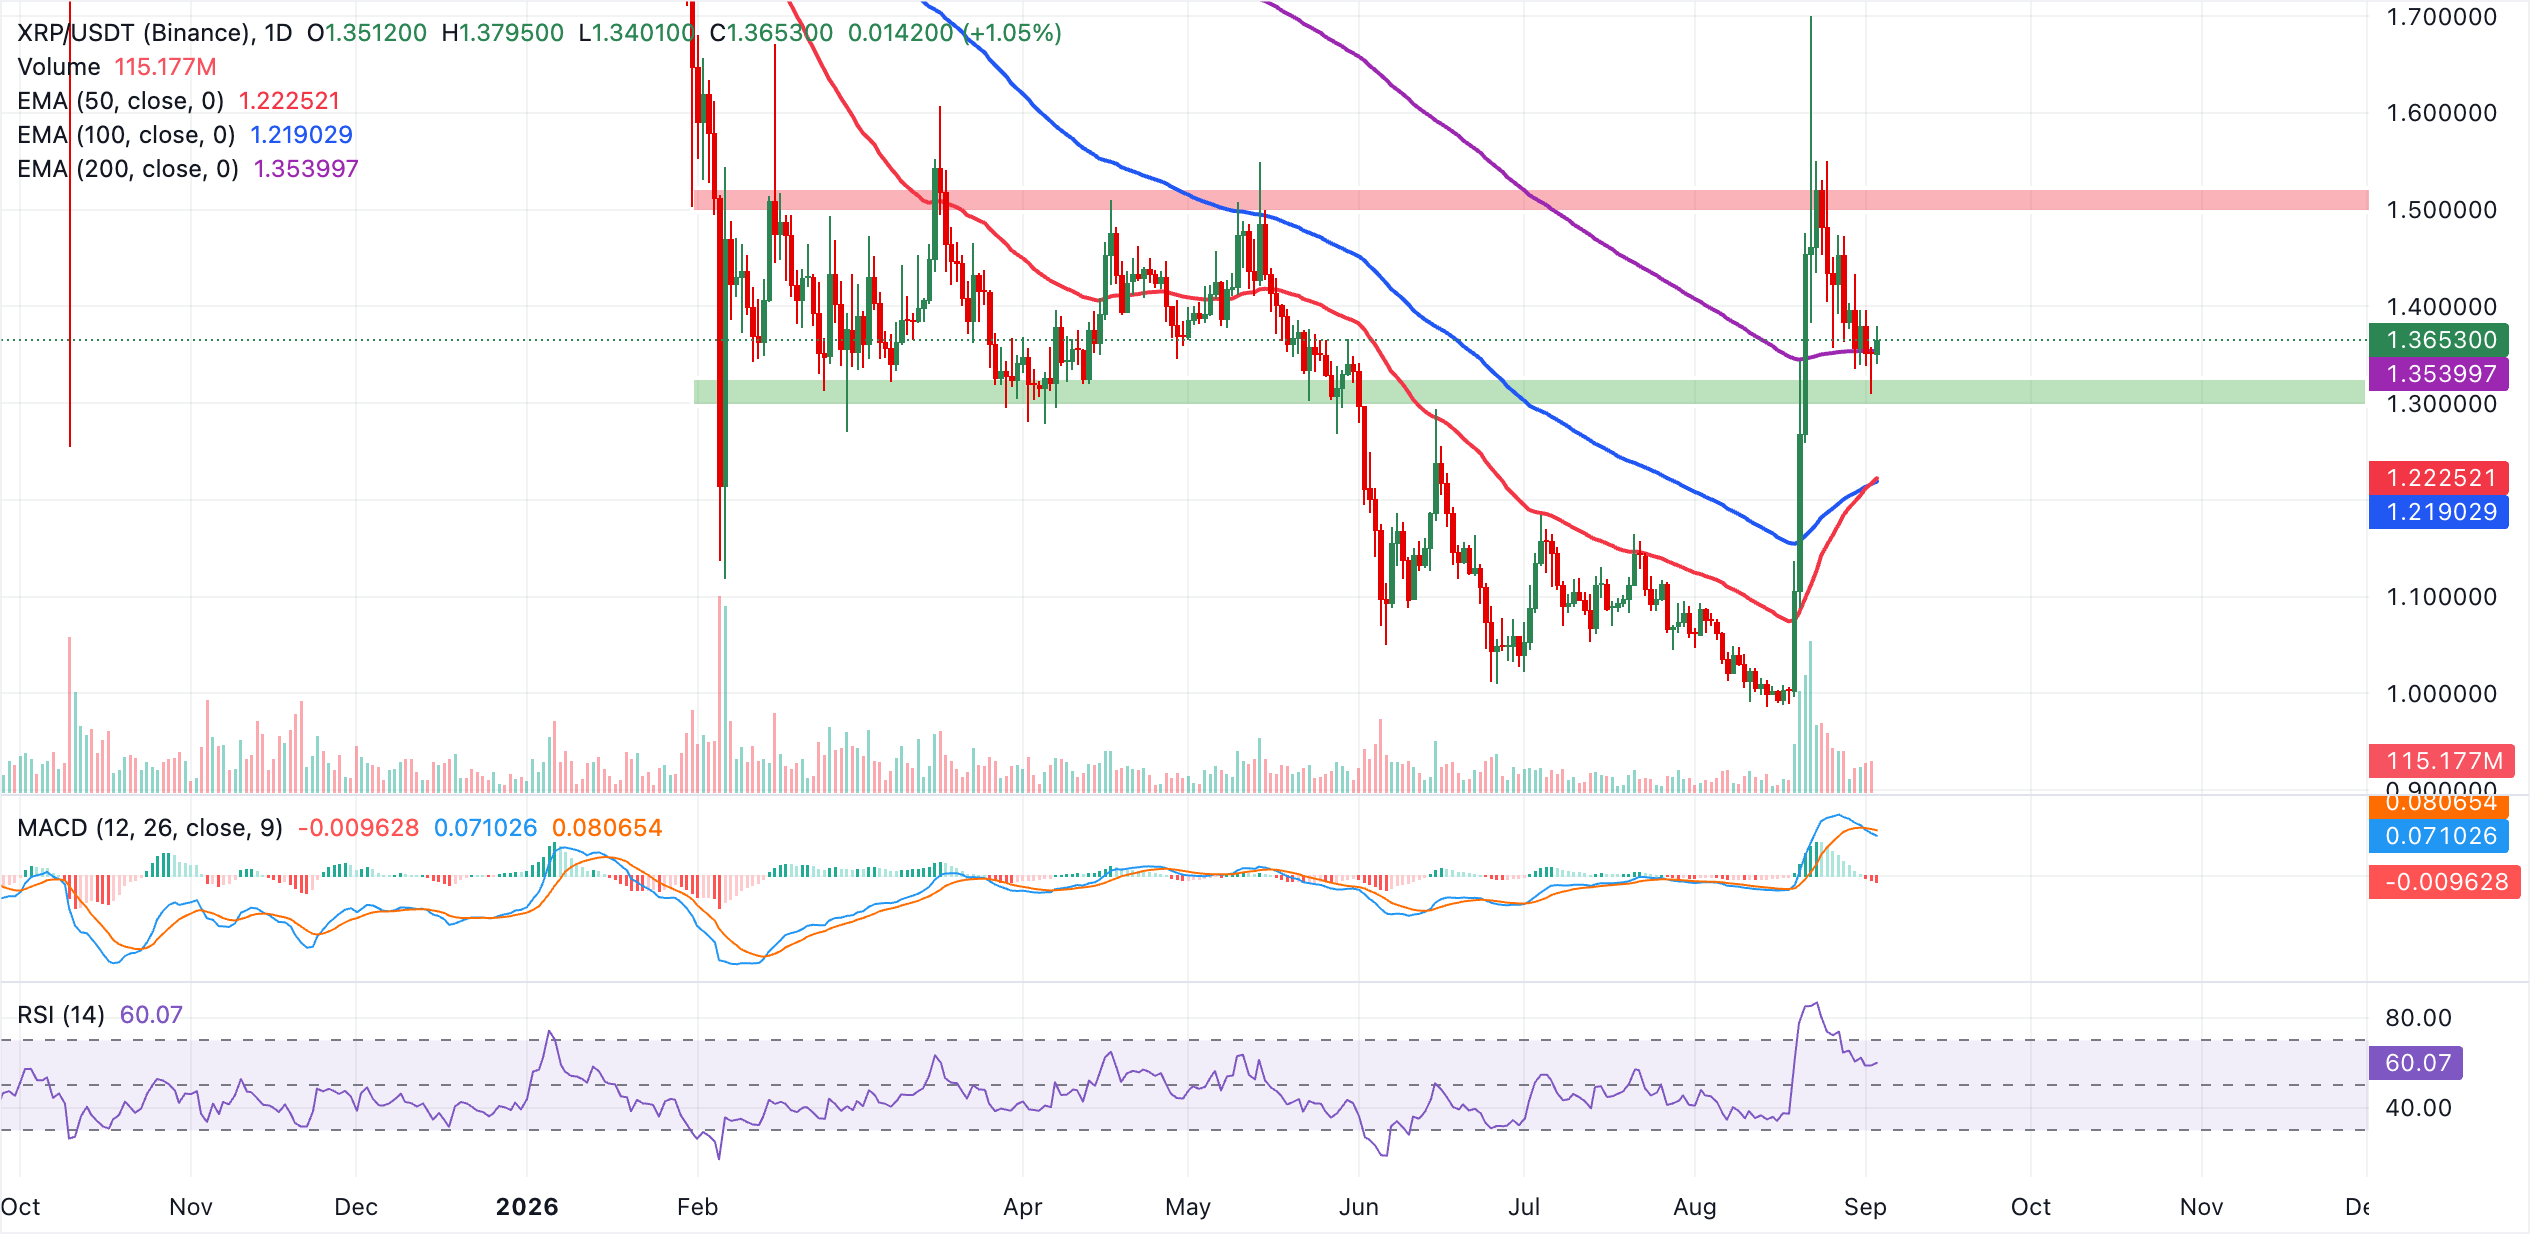
Immediate support lies at the 200-day EMA at $1.35, followed by a deeper demand zone around the 50-day EMA at $1.22 and the 100-day EMA at $1.22. With no clear overhead technical levels on the daily chart, price action around $1.36 acts as a near-term pivot. A sustained hold above this area would keep the bullish tone intact, while a daily close back below $1.35 would hint at a broader correction toward the EMA cluster in the low $1.22s.
(The technical analysis of this story was written with the help of an AI tool. Know more.)
About The Author