US Dollar Index (DXY): Arc cycle analysis
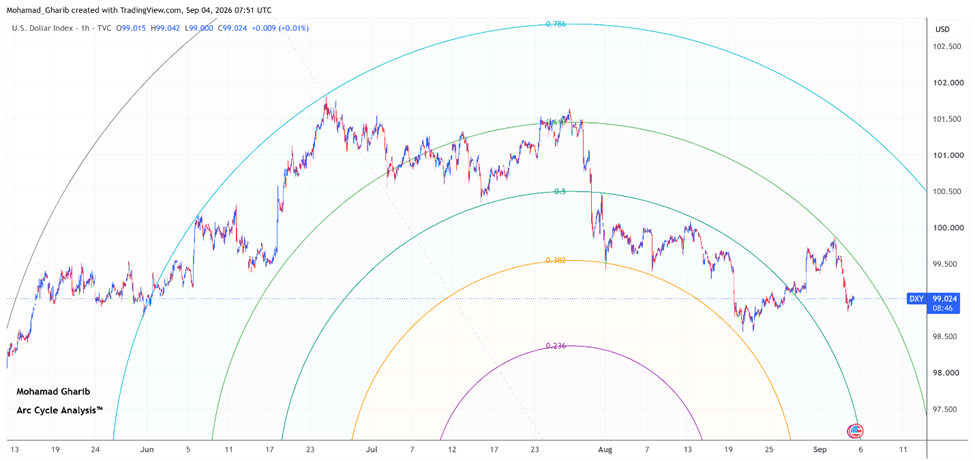
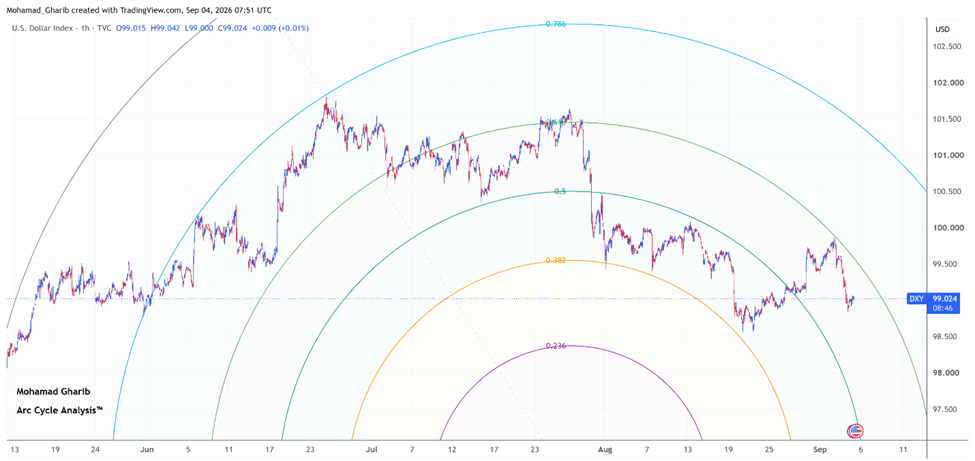
Overview: Based on Arc Cycle Analysis applied to the 1h chart, the US Dollar Index is interacting with the 0.618 Resistance Arc within the current Arc Cycle. Bullish momentum has faded near this boundary, indicating that the upper Arc continues to cap upside expansion.
|
Metric |
Reading |
|
Market Bias |
Neutral-Bearish |
|
Preferred Scenario |
Two-Way Navigation Within the Current Arc Range |
|
Target Arc |
0.5 Arc |
|
Potential Interim Move |
An interim retest of the upper 0.618 Arc may occur at 99.34 before broader directional continuation. |
|
Current Arc Level |
In Transit Between Arcs (0.618 Arc to 0.5 Arc) |
|
Cycle Status |
Mid-Cycle Migration Phase |
Market outlook
The 0.618 Arc continues to act as a resistance boundary, capping upside expansion. Bullish attempts have stalled beneath the Resistance Arc, indicating that the resistance remains intact.
If the Resistance Arc holds firm, a decline toward the 0.5 Target Arc becomes the primary scenario. Conversely, a sustained 1h close above the Arc would invalidate the bearish scenario, opening the path toward the next upper Resistance Arc 0.618.
About The Author