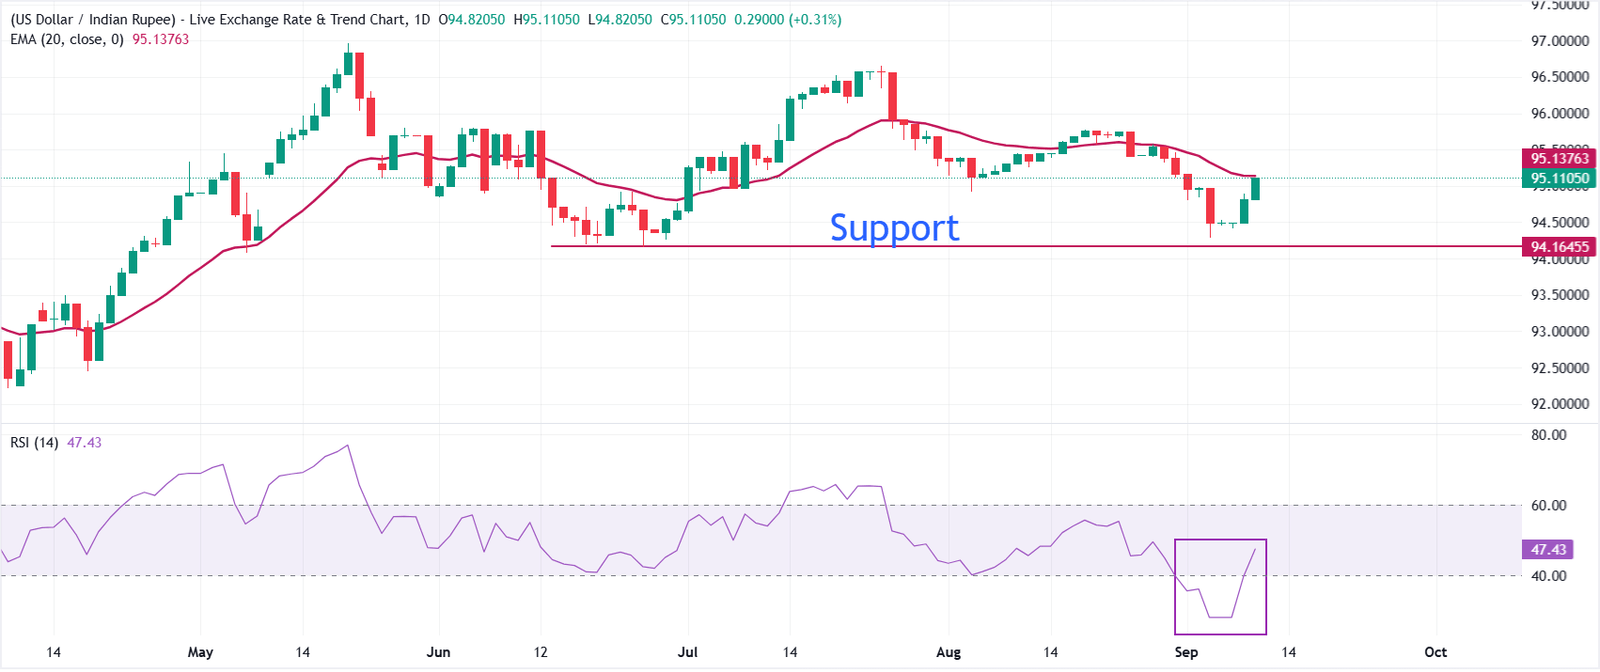
The Indian Rupee (INR) extends its decline against the US Dollar (USD) on Wednesday after a sharp correction the previous day. The USD/INR pair jumps marginally above 95.11 as surging energy prices have battered the Indian currency significantly.
As of writing, the MCX Crude Oil contract expiring on September 21 trades higher by over 2.5%, slightly above Rs. 8,950, the highest level seen since May 22.
Currencies from economies, such as India, which rely heavily on oil imports to meet their energy needs, tend to underperform in a high-oil-price environment.
Escalating US-Iran attacks boost oil prices
Rising tit-for-tat attacks between the US and Iran in the past few weeks have prompted fears of prolonged energy supply disruption again.
Earlier in the day, Iran’s Islamic Revolutionary Guard Corps (IRGC) launched ballistic missile strikes targeting the Al Azraq air base in Jordan, which shelters US military personnel and aircraft, in response to US Central Command (CENTCOM) consistently bombing Iranian tankers in the Gulf of Oman, Al Jazeera reported.
Meanwhile, the data from Kpler shows that the number of commodity vessels sailing through the Strait of Hormuz totalled seven on September 7, compared with eight on the previous day, Reuters reported. This is a significant decline from an average of 130-140 ships transiting through Hormuz before the Middle East war started.
Falling INR prompts fears of RBI intervention
A significant decline in the Indian currency this week has prompted fears of the Reserve Bank of India’s (RBI) stealth intervention through spot and Non-Deliverable Forward (NDF) markets.
The table below shows the percentage change of Indian Rupee (INR) against listed major currencies today. Indian Rupee was the strongest against the US Dollar.
| USD | EUR | GBP | JPY | CAD | AUD | INR | CHF | |
|---|---|---|---|---|---|---|---|---|
| USD | -0.08% | -0.08% | -0.41% | -0.08% | -0.17% | 0.31% | -0.13% | |
| EUR | 0.08% | 0.00% | -0.34% | -0.01% | -0.11% | 0.47% | -0.04% | |
| GBP | 0.08% | -0.01% | -0.33% | 0.02% | -0.09% | 0.43% | -0.04% | |
| JPY | 0.41% | 0.34% | 0.33% | 0.34% | 0.24% | 0.78% | 0.30% | |
| CAD | 0.08% | 0.01% | -0.02% | -0.34% | -0.10% | 0.45% | -0.04% | |
| AUD | 0.17% | 0.11% | 0.09% | -0.24% | 0.10% | 0.56% | 0.07% | |
| INR | -0.31% | -0.47% | -0.43% | -0.78% | -0.45% | -0.56% | -0.50% | |
| CHF | 0.13% | 0.04% | 0.04% | -0.30% | 0.04% | -0.07% | 0.50% |
The heat map shows percentage changes of major currencies against each other. The base currency is picked from the left column, while the quote currency is picked from the top row. For example, if you pick the Indian Rupee from the left column and move along the horizontal line to the US Dollar, the percentage change displayed in the box will represent INR (base)/USD (quote).
According to a Reuters report, while the Indian central bank was present in the market on Tuesday, traders said the intervention was not enough to prevent the Indian Rupee from weakening. Early Wednesday, the Indian central bank was also expected to have sold US Dollars to arrest the Indian Rupee slide.
US Inflation will be key trigger this week
This week, the major trigger for the USD/INR pair will be the US Consumer Price Index (CPI) data for August, which will be released on Friday. The inflation data is expected to have a significant influence on the US interest rate outlook.
According to TD Securities, upcoming inflation data should be “subdued enough to keep the Fed on hold,” though they stress that “the PCE translation will be key.” The bank estimates that, if their forecast is realized, “core PCE would likely be a modest 0.18% m/m, with market-based an even more subdued 0.13%.” They argue that such an outcome “would be a welcome number for the more centrist members of the FOMC like Waller and Williams, and in our view, would be enough to keep the Fed on hold in September.”
Technical Analysis: USD/INR recovers to near 20-day EMA
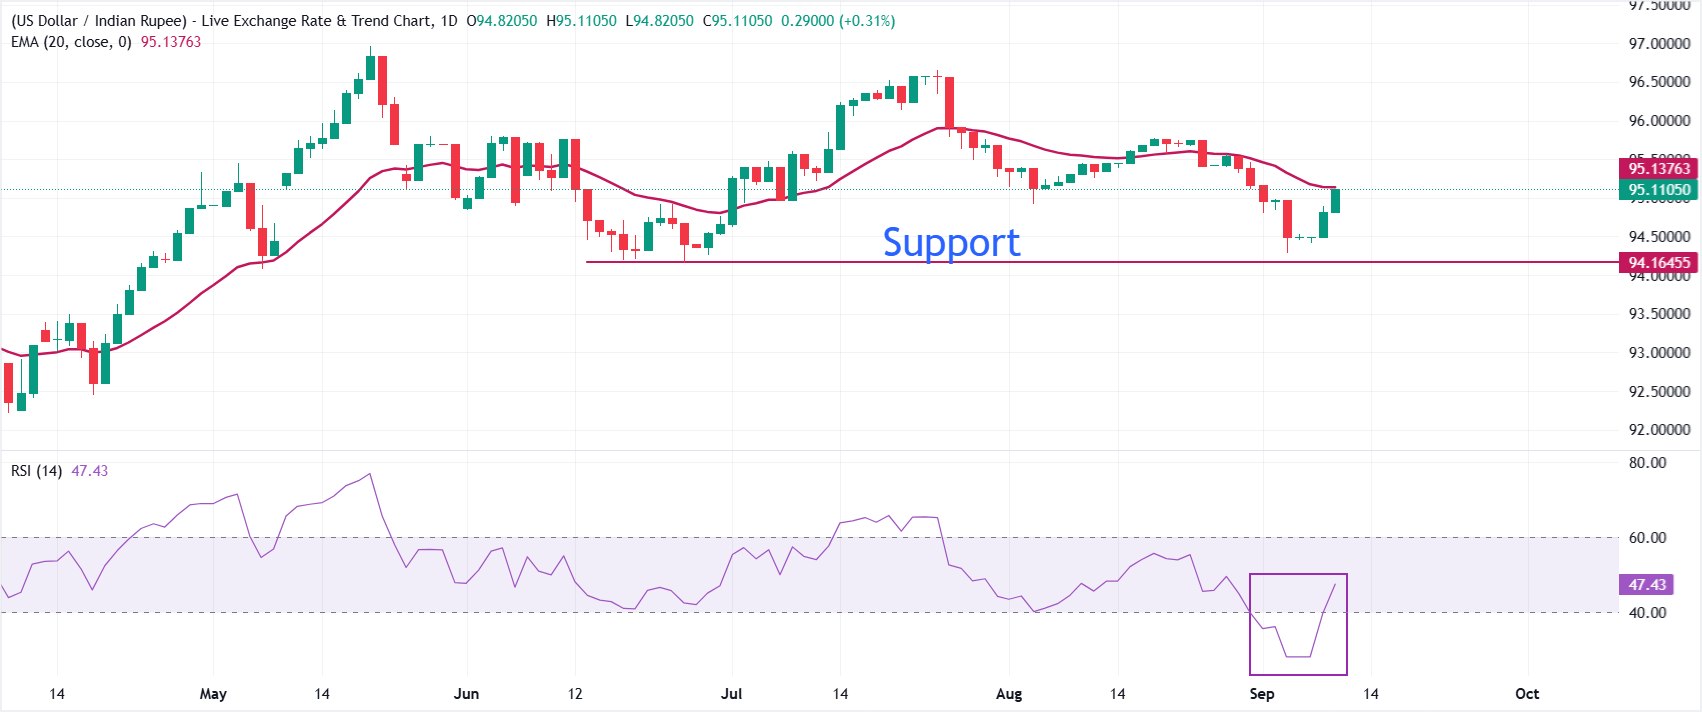
In the daily chart, USD/INR trades at 95.11. The pair has recovered strongly to near the 20-day exponential moving average (EMA) at 95.13, suggesting strong demand at lower levels.
The Relative Strength Index (14) recovers quickly into the 40.00-60.00 zone after staying below 40.00 for a few trading days, backing the view of strong buying interest at lower levels.
On the topside, initial resistance is located at the 20-day EMA around 95.13; a daily close above this level would be needed to ease immediate selling pressure and open the way for a more sustained rebound toward 95.50. Looking down, the June low at 94.15 will remain the key support area.
(The technical analysis of this story was written with the help of an AI tool. Know more.)
About The Author