- The US Dollar regains ground as US President Donald Trump walks back the threat to remove Fed Chair Jerome Powell.
- The US Dollar Index trades near three-week highs, buoyed by sticky inflation and stable Treasury yields.
- Technical breakout signals bullish momentum, with upside targets at 99.50 and the psychological 100.00 level.
The US Dollar (USD) gains positive traction on Thursday, recovering from a brief wobble late Wednesday after reports emerged that US President Donald Trump was considering firing Federal Reserve (Fed) Chair Jerome Powell. Market tensions eased after Trump walked back the threat, stating it was “highly unlikely” that he would dismiss Powell. The Greenback also finds support from stronger-than-expected Retail Sales data, which highlights resilient consumer spending and reduces the likelihood of near-term Fed rate cuts.
The US Dollar Index (DXY), which tracks the value of the Greenback against a basket of six major currencies, is trading on the front foot near three-week highs during the American trading session. At the time of writing, the index is hovering around 98.74, up 0.45% on the day.
Latest US economic data offered further evidence of resilient consumer demand and labor market strength. Retail Sales rose 0.6% MoM in June, well above the 0.1% forecast, rebounding from May’s sharp 0.9% drop. Core Retail Sales, which exclude autos and gas, also climbed 0.5%, up from 0.2% previously. Initial Jobless Claims fell to 221,000 last week, below the expected 235,000, signaling ongoing tightness in the labor market. Meanwhile, the Philadelphia Fed Manufacturing Index surprised to the upside, surging to 15.9 in July from -4.0 in June, far exceeding market expectations of -1.
Political interference in the Federal Reserve can create serious problems for financial markets. If Powell were removed, it could shake confidence in the Fed’s independence. A new chair might take a different approach to interest rates, possibly cutting them faster. This can shake confidence in the US Dollar and lead to higher volatility in Stocks and Bonds. Several top Wall Street executives have warned that if the Fed’s independence is weakened, it could harm the US economy in the long run and erode the US Dollar’s status as the world’s reserve currency.
While recent Consumer Price Index (CPI) and Producer Price Index (PPI) figures have shown signs of cooling, with June’s consumer prices rising at a slower pace and producer prices coming in flat month-over-month, the broader pricing trend remains sticky. Additionally, several Fed officials maintained a cautious tone on Wednesday, citing rising inflation risks tied to recent trade tariffs. This gives the Fed reason to hold off on rate cuts for now.
Market Movers: Tariff tensions mount, inflation jumps and rate cuts priced out
- Headline PPI was flat in June, showing no monthly growth, compared to the 0.2% increase markets had expected, and down from a 0.3% rise in May. The surprise softness was due to lower service costs, despite a slight rise in goods prices. On an annual basis, PPI slowed to 2.3%, also below the 2.5% forecast and the 2.6% reading from the previous month. The data suggests producer-level inflation remains under control, easing some concerns about tariff-driven price pressures. However, sticky core inflation keeps the Fed’s policy outlook tilted hawkish, limiting downside for the US Dollar.
- Consumer inflation in the US accelerated in June, with headline CPI rising 0.3% MoM and 2.7% YoY, both in line with expectations. Core CPI, which excludes food and energy prices, climbed 0.2% MoM and 2.9% YoY. The data showed clear signs of tariff-related price pressure. The hotter-than-expected inflation print has sharply reduced the odds of a near-term Fed rate cut. Markets now price in just a 2.6% chance of easing in July and 55.8% for September, down from 70% last week.
- On Wednesday, New York Fed President John Williams warned that the full economic impact of the tariffs is just beginning, estimating they could add around 1 percentage point to inflation in the second half of 2025. Atlanta Fed President Raphael Bostic echoed the concerns, noting that a growing share of consumer goods are showing price increases above 5%, suggesting underlying inflation may be picking up.
- President Trump signaled a tougher stance on trade on Wednesday, confirming that the 25% tariff on Japanese imports will remain in place. When asked about a potential deal, Trump responded, “I think we’ll probably live by the letter,” implying no agreement is likely in the near term. Trump also announced plans to send letters to over 150 smaller countries, warning that their tariff rates could be raised to 10% or 15%. He indicated that these countries “don’t do much business” with the US and the new rates would be “the same for everyone, for that group.”
- With the August 1 tariff deadline approaching, only the UK, Vietnam, and Indonesia have secured formal trade agreements with the United States, while China has reached only a “preliminary trade agreement.” The US is reportedly “very close” to finalizing an agreement with India and sees potential for a deal with the European Union (EU), though both remain under negotiation.
Technical Analysis: DXY bulls regain control after falling wedge breakout
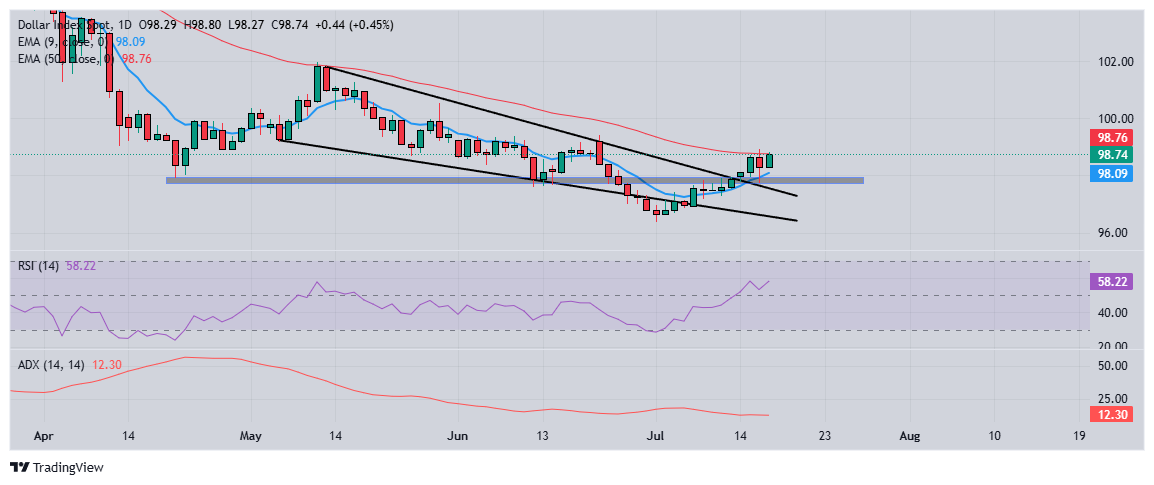
The US Dollar Index (DXY) is showing early signs of a bullish reversal after breaking out of a falling wedge pattern that had capped price action for over two months. This breakout suggests that bearish momentum is weakening, and buyers are gradually regaining control. The index is now testing a key resistance zone around 98.70-98.80, which aligns with the 50-day Exponential Moving Average (EMA). A clear break and daily close above this zone could confirm bullish momentum and pave the way toward the 99.50 region, near the June 23 swing high, and possibly extend toward the psychological 100.00 level.
On the downside, the 9-day EMA at 98.09 continues to act as dynamic short-term support, sloping upward and helping to cushion minor pullbacks. It also aligns with the former resistance-turned-support zone near 98.00-97.80. A break below this area could undermine bullish momentum and expose the index to a deeper retracement, with the next support seen near 97.50.
Momentum indicators support the bullish bias. The Relative Strength Index (RSI) is rising and hovers near 58 on the daily chart, indicating increasing buying interest without yet reaching overbought conditions. However, the Average Directional Index (ADX) remains low at 12.30, implying the trend is still developing.
US Dollar PRICE Today
The table below shows the percentage change of US Dollar (USD) against listed major currencies today. US Dollar was the strongest against the Australian Dollar.
| USD | EUR | GBP | JPY | CAD | AUD | NZD | CHF | |
|---|---|---|---|---|---|---|---|---|
| USD | 0.50% | 0.11% | 0.48% | 0.51% | 0.84% | 0.44% | 0.57% | |
| EUR | -0.50% | -0.39% | -0.02% | 0.04% | 0.36% | -0.03% | 0.10% | |
| GBP | -0.11% | 0.39% | 0.36% | 0.42% | 0.73% | 0.33% | 0.47% | |
| JPY | -0.48% | 0.02% | -0.36% | 0.00% | 0.33% | -0.03% | 0.09% | |
| CAD | -0.51% | -0.04% | -0.42% | 0.00% | 0.41% | -0.08% | 0.06% | |
| AUD | -0.84% | -0.36% | -0.73% | -0.33% | -0.41% | -0.49% | -0.27% | |
| NZD | -0.44% | 0.03% | -0.33% | 0.03% | 0.08% | 0.49% | 0.14% | |
| CHF | -0.57% | -0.10% | -0.47% | -0.09% | -0.06% | 0.27% | -0.14% |
The heat map shows percentage changes of major currencies against each other. The base currency is picked from the left column, while the quote currency is picked from the top row. For example, if you pick the US Dollar from the left column and move along the horizontal line to the Japanese Yen, the percentage change displayed in the box will represent USD (base)/JPY (quote).