- Gold price continues to attract safe-haven flows on Monday amid trade-related uncertainties.
- The USD dived to a two-year low amid recession fears that further benefit the XAU/USD pair.
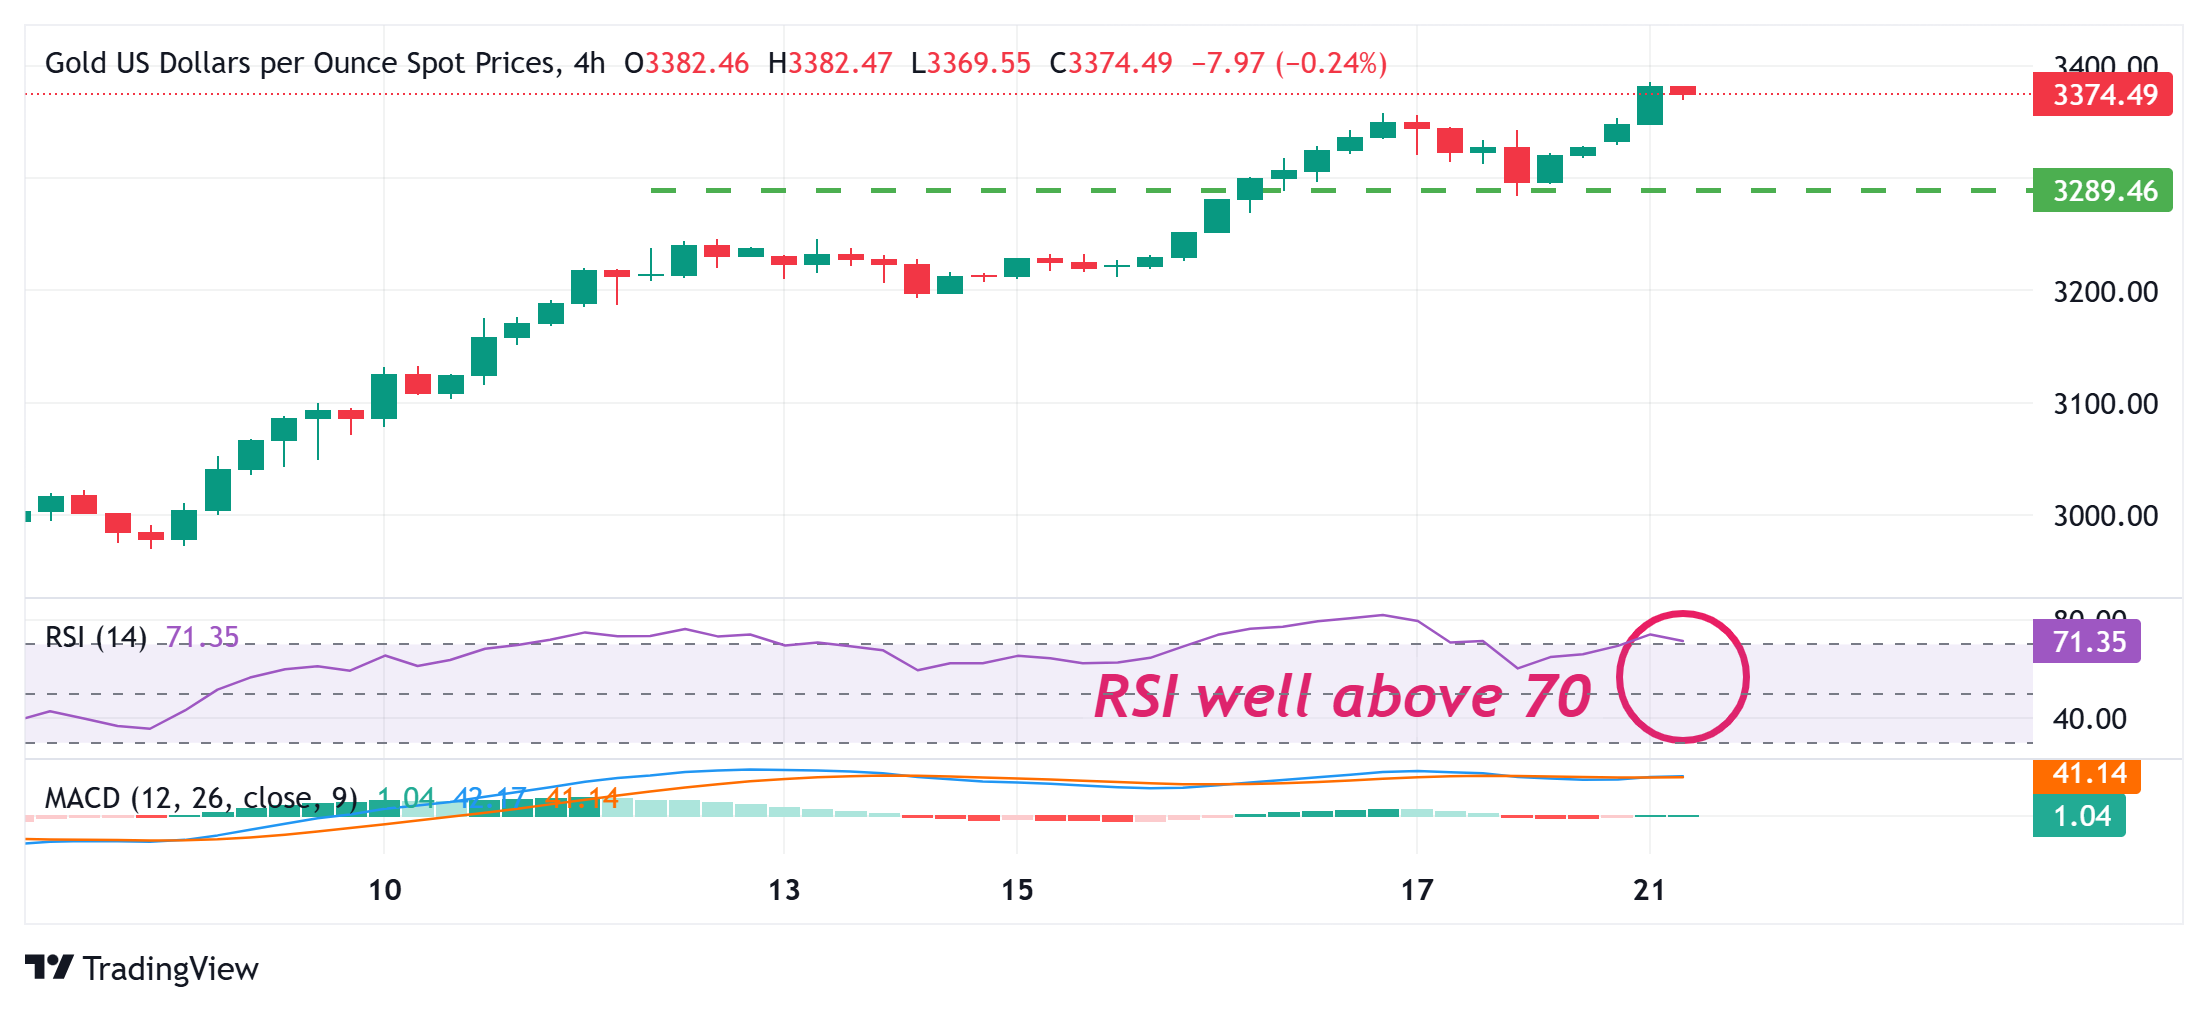
- Overbought conditions on the daily chart warrant caution before placing fresh bullish bets.
Gold price (XAU/USD) sticks to its strong intraday gains heading into the European session on Monday and currently trades near the all-time peak, well within striking distance of the $3,400 round figure. Trade-related uncertainties continue to weigh on investors’ sentiment, which is evident from the underlying bearish sentiment around the global financial markets and benefits the safe-haven precious metal.
Furthermore, US President Donald Trump’s back-and-forth tariff announcements have dented confidence in the US economy. This, along with bets that the Federal Reserve (Fed) will resume its rate-cutting cycle soon, drags the US Dollar (USD) to its lowest level since April 2022 and provides an additional boost to the non-yielding Gold price. The XAU/USD bulls, meanwhile, seem unaffected by overbought conditions.
Daily Digest Market Movers: Gold price is underpinned by the global rush to safety and broadly weaker USD
- Investors remain worried about the potential economic fallout from US President Donald Trump’s trade tariffs and the rapidly escalating US-China trade war, pushing the safe-haven Gold price to a fresh all-time peak on Monday. In fact, Trump recently imposed tariffs of up to 145% on certain Chinese goods, with some duties reportedly reaching 245%. In retaliation, China has levied tariffs of 125% on US products.
- Meanwhile, Trump’s aggressive trade policies could hurt the world trade order and trigger a recession in the US. This, in turn, drags the US Dollar to its lowest level since April 2022 and further benefits the precious metal. The USD bulls shrugged off Federal Reserve Chair Jerome Powell’s hawkish comments, saying that the central bank is well-positioned to wait for more clarity before making any changes to the policy stance.
- Furthermore, market participants are still pricing in the possibility that the Fed will resume its rate-cutting cycle in June and lower borrowing costs by a full percentage point by the end of this year. This turns out to be another factor that contributes to driving flows towards the non-yielding yellow metal, amid thin trading conditions on the back of the Easter Monday holiday and despite overbought conditions on the daily chart.
- Iran and the US agreed on Saturday to commence expert-level discussions to design a framework for a potential nuclear deal. Moreover, Russian President Vladimir Putin’s one-day ceasefire in Ukraine on Saturday sparked hopes that tensions could de-escalate. This, however, does little to boost investors’ confidence or dent demand for traditional safe-haven assets, supporting prospects for a further appreciation for the XAU/USD pair.
- There isn’t any relevant market-moving economic data due for release from the US on Monday, though a scheduled speech from Chicago Fed President Austan Goolsbee might influence the USD. Apart from this, trade-related developments should provide some impetus to the commodity. The market focus will then shift to the release of flash PMIs on Wednesday, which should offer a fresh insight into the global economic health.
Gold price bulls not ready to give up yet despite overbought conditions on short-term charts

From a technical perspective, the relentless buying validates the near-term positive outlook for the Gold price. However, the daily Relative Strength Index (RSI) is holding well above the 70 mark and might force bullish traders to pause for a breather. Hence, it will be prudent to wait for some near-term consolidation or a modest pullback before positioning for an extension of a multi-month-old uptrend.
In the meantime, any corrective slide might now find some support near the $3,350 zone. This is followed by the Asian session low, around the $3,329-3,328 region, below which the Gold price could accelerate the fall towards the $3,300 round figure en route to Friday’s swing low, around the $3,284 area. The latter should act as a key pivotal point, which if broken decisively could pave the way for deeper losses.
US Dollar PRICE Today
The table below shows the percentage change of US Dollar (USD) against listed major currencies today. US Dollar was the strongest against the Canadian Dollar.
| USD | EUR | GBP | JPY | CAD | AUD | NZD | CHF | |
|---|---|---|---|---|---|---|---|---|
| USD | -1.05% | -0.64% | -0.97% | -0.37% | -0.59% | -1.19% | -0.90% | |
| EUR | 1.05% | 0.27% | 0.06% | 0.65% | 0.28% | -0.17% | 0.13% | |
| GBP | 0.64% | -0.27% | -0.04% | 0.39% | 0.00% | -0.44% | -0.14% | |
| JPY | 0.97% | -0.06% | 0.04% | 0.60% | 0.24% | -0.11% | 0.10% | |
| CAD | 0.37% | -0.65% | -0.39% | -0.60% | -0.35% | -0.82% | -0.51% | |
| AUD | 0.59% | -0.28% | -0.00% | -0.24% | 0.35% | -0.43% | -0.14% | |
| NZD | 1.19% | 0.17% | 0.44% | 0.11% | 0.82% | 0.43% | 0.32% | |
| CHF | 0.90% | -0.13% | 0.14% | -0.10% | 0.51% | 0.14% | -0.32% |
The heat map shows percentage changes of major currencies against each other. The base currency is picked from the left column, while the quote currency is picked from the top row. For example, if you pick the US Dollar from the left column and move along the horizontal line to the Japanese Yen, the percentage change displayed in the box will represent USD (base)/JPY (quote).