ANCA DIENESandWILLIAM FAZACKERLEY, Emerson
Part 1 of this two-article series, “Explaining sand erosion challenges in oil and gas production,” ran in the May 2024 issue of World Oil, and it examined issues with sand erosion. This article presents solutions to address the issues raised in Part 1, and it includes two use cases demonstrating the effectiveness of the solutions.
Sand erosion poses significant challenges in the oil and gas industry, because it can lead to equipment damage, production loss and costly repairs. Existing sand control techniques—such as well completion, sand screens, gravel packs, sand cyclones or desanders, or even predictive models for sand production—are not fully effective. Part 1 of this series discussed sand erosion issues in detail, and this article—Part 2—shows how the integration of acoustic sensors and ultrasonic thickness (UT), to detect and assess sand particles in pipelines and process equipment, addresses these issues.
This article presents a practical, cost-effective solution for successful sand management in the oil and gas industry, by leveraging two complementary, non-intrusive technologies for sand and erosion monitoring: acoustic particle sensors and wireless UT sensors.
MEASURING ENTRAINED SAND
Non-intrusive acoustic particle sensors detect the noise generated by solid particles and derive it intoentrainedsand measurement.This technologyutilizesthe fact that the solid particles, while transportedinthe flow,impactthe pipe wall,due to inertia in pipe bends,and create noise. The sensor picks up the noise that propagates in the pipe wall and converts it to a digital signal in the form of sand rate (g/s), sand intensity (µV)or accumulated sand mass (g).
It is critical to get accurate, early signals that sand is present in the pipe fluid, before the pipe faces potential erosion damage. The accurate detection of solids in the flow, and the quality of the output signal, depends on the correlation of these multiple factors:

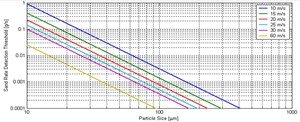
Fig. 1. This graph shows the correlation between velocity and particle size for entrained sand rate detection. Smaller particles require higher velocity to be detectable by an acoustic sensor, while larger particles may be detectable at lower velocities.
- Flow velocity-Solid particles in the flow will produce a noise,only when they are moving, meaning there is enough kinetic energyfor the particlesto hit the inner pipe wall.
- Type of flow-This isimportant,becausevarious flow phases—such as liquid, gas or mixed—will eachgenerate a different flow noise. It is also important,becausesand is carried differently in various phases (i.e.,velocitiesare typically higherin gas and lower in liquid phases).
- Mounting location-The typical mounting location foranacoustic sensor is at the wellhead,downstreamofa 90° bend,to maximize the effect of inertia and pipe geometry, ensuringproper measurement.
- External noise-The noise from nearby pumps or valves can affect the reading,ifit isnot eliminated,becausethe acoustic sensor will pick it up asnoise from entrainedsandandgenerate a higher ratethan actual, soa background noise calibration performed on site is necessary to eliminate the frequencies associated with external noise.
- Particle size and type-The sound signature of particles varies with their type and size. For example,sand, proppant and barite are heavy particles (2.65 – 4.5g/cm3),1and thus, theyproduce a loud noise when impacting metal, making it easier to detect their presence at lower velocities, as opposed to chalk, which is a soft particle and would,therefore,require high velocities to be detectable by an acoustic sensor. Particle size is directly correlated with particle type and velocity,Fig.1.
Depending on the use case and application, operatorscanutilizeentrainedsand measurement data invarious ways, including:
- Production optimization inoffshoreandonshoreoil and gas-Uncontrolled sand can lead to reduced production,due to pipe cloggingand rotating equipment damagefromerosion, generating losses of hundreds of thousands of dollars per day. In thisapplication, operatorscanadjust theproductionflowrate,based on theentrainedsandmeasurement.
- Flowback and clean-up of a new oil and gas well – Flow velocities and erosion potential are usually lower in this application, but operators would like to end the flow-back/clean-up phase as soon as possible, while avoiding sand separator fill-up. Based on entrained sand intensity readings, operators can assess the flow-back status and separator efficiency on critical wells, and then decide if they should release the well for production.
- Manage erosion risk during peak retrieval in underground gas storage-Erosive potential canincreasesubstantially duringpeak retrieval periods,resulting inlost production andincreasedmaintenance. Based on theentrainedsand rate, operatorscanregulate the gas retrieval flowrate on critical wells, as shown in thesecondusecasebelow.

Fig. 2. These two measurement technologies can be used together to improve operations.

EVALUATING EROSION AND CORROSION EFFECTS
In all the above cases, operators can base their decisions on the risk component (i.e., entrained sand is present in the flow and can hinder production or cause a shutdown), but further value can be created from erosion monitoring, using ultrasonic (UT) thickness measurement technology. Figure2shows commercially available technologies to measure both acoustic and ultrasound,providing the data needed fora combined risk and impact calculation.
Real-time wall thickness monitoring of equipment and associated piping provides valuable insight into the status of equipment and components. The data can be trended against fluid characteristics (i.e., pH, dissolved oxygen, H2S and CO2 concentrations, corrosion, scale and inhibitor residuals, etc.) and process data (i.e., pressure, temperature, flowrates, etc.). These trends highlight potential areas of erosion and concern, and they enable preventative measures to be undertaken in a timely manner. This monitoring technology is commonplace in oil refineries, where it is used to measure the impact of corrosion, and it is widely accepted as an industry best practice for upstream oil and gas production applications.2
The only maintenance cost associated with online thickness monitoring systems is the replacement of batteries, once every 10 years or so. Mounting flexibility means that as conditions change, such as the corrosivity and erosivity of the fluids, sensors can simply be moved by site personnel while the facility is operational.
It is important to highlight that the loss in the pipe wall thickness is often a result of combined corrosion and erosion damage. Erosive elements or mechanisms,such asentrainedsand, accentuate the damage produced by corrosion. The key benefitof UT sensorsis that a quantitative measurementofactual wall thicknessis supplied, with no inferred corrosivity or baseline subtraction method. This measurementgives operatorsa high levelof confidence in the health of the asset,anditallows optimization of operating conditions.

Fig. 3. Wireless non-intrusive thickness sensors installed in an offshore environment.
The use of acoustic sensors enables the detection of solid particles—including sand—through their unique acoustic signatures. These sensors provide real-time data, allowing for proactive monitoring of sand production. In combination with UT sensors, which provide accurate measurements of material thickness, a risk and impact calculation can be derived. By analyzing the risk value obtained from the acoustic sensor and the impact value obtained from the thickness sensor, an overall assessment of asset health can be determined.
OFFSHORE OIL AND GAS USE CASE
An oil and gas operator in the North Sea was faced with challenges in a mature field, due to an increasing rate of sand production and erosion events. In this case, the produced sand caused rapid erosion in pipes, valves and vessels, forcing the operator to produce below the well’s potential, due to increased required maintenance for the rotating equipment and chokes. Maintenance operations required temporary shutdowns of the well, resulting in lost revenue and increased repair costs.
To increase production without jeopardizingassetintegrity, the operator deployed a combination of eight non-intrusive acoustic sand monitors and eight non-intrusiveUTsensors,Fig.3.

Fig. 4. This conceptual representation depicts a combined solution with non-intrusive thickness sensors and acoustic sensors.
The acoustic sand monitors provided actionable risk information in the form of instantaneousentrainedsand rate data, while the UT sensors provided the metal loss input,due toerosion caused by sand production.Figure4showsthe correlation between theentrainedsand rate and metal loss data.
Usinginsightsprovided by this data,the operator was able to confidently detect sand bursts and adjust production rate when needed, while continuouslymonitoringmetal loss and remaining asset life.The teamincreased production 2%,resulting in added revenue of $2 millionper year, andtheydecreased unexpected shutdowns by adjusting the choke to minimumentrainedsand andconsequenterosion.
UNDERGROUND GAS STORAGE USE CASE
Another case study describes the safety and profitability challenges that an underground gas storage facility in Europe was facing because of uncontrolled,entrainedsand production, andit showshowasand monitoring solutionhelpedthe operatorsaddress these and other related issues.
Natural gas demand often peaksduring the winter season,due to its use inhome and commercialheating, requiringa high volume of gasdeliveryto thetransmission networkina short periodof time. Gas is stored in underground depleted reservoirs or salt caverns, allowing a high volume of storage to meet the demand. Undesirable solids areproduced,due to the high velocityrequiredduring peak retrieval, and at this site, solids haddamaged the pipe work and resulted in a loss of containment incident for the largest well. The immediate action was to shut down the well for the rest of the winter season,resulting in substantiallost revenue, along with negativesafety and environmental impacts.
To avoid other incidents with the 300 wells at the site, the operator opted for a temporary,non-intrusive sand monitoring solution that was deployed in a few days,withno interruptions toproduction,and whichidentifiedthe presence of sand in multiple locations. Alarms were also configuredforreal-timedetection ofanysmall increasein sandproduction,as retrieval ratesincreased.
Following the successful trial, the operator gained confidence in the sand monitoring solution andproceededto instrument another 105 wells with non-intrusive acoustic particle monitorsbefore the start of the next cold season. The deployed solution enabledthe operator to choke down the production rate when sand production exceededanacceptable threshold, thusreducingerosion risk during peak season, whilemitigating erosion impact on the pipework.
In parallel,the operator is exploring deployment ofnon-intrusiveUTsensors,to gain real-time insight onmetal loss,due toerosion and remaining pipe life.
CONCLUSION
Sand production is a worldwide problem, occurringwhen the stress on the formation exceeds the formation strengths and results in rock failure. The produced solid particles cause rapid erosion in pipes, valves,pumpsand vessels, forcing operators to produce below potential, whileincreasing requiredmaintenance and repair activities.
Traditionalmanualsand and erosion measurement techniques may provide a good characterization of the solid particles (i.e.,particle size and type), but the datagatheredareinfrequent and unrepeatable and can easily generate blind spots, leadingoperatorsto increase or decreaseproductionrateswithin the wrong operating windows. The data from manual measurements will always be information of the past, sotheydo notgive operatorsan opportunityto react in time to mitigate erosion risk.
If erosion is more serious than operators expect it to be, then they are likely to experience leaks and loss of containment. On the other hand, if the actual erosion rates experienced are less thananticipated, then operatorsmay have beenable to produce more and deliver better profitability. To increase production without jeopardizingasset integrity, oil and gas operators across the world are opting for online monitoring solutions that can provide them with clear insights into what is happening inside the pipe,so that they can act with confidence.
This articlepresented a practical solution for effective sand management,by incorporatingtwo complementary non-intrusive erosionmonitoringsolutions: acoustic particle sensors andUTsensors. The benefits of combining these two technologies include enhanced asset integrity, reduceddowntimeand improved maintenance planning. Additionally, the ability tomonitorsand production and erosion in realtime empowers operators tooptimizeproduction rates,while ensuringassetintegrity.
ANCA DIENESis a global product manager in Emerson’s corrosion and erosion business unit, with over 13 years of experience in customer care and pricing. She supports new product development, translatingcustomerrequirements into engineeringinsightsto build competitive productsthat are aligned with Emerson’svision of growth.Ms.Dienes studiedmechanicalengineering andmanagement atTechnical University of Cluj-Napoca,in Romania.
WILLIAMFAZACKERLEYis a global product manager in Emerson’s corrosion and erosion business unit, with over 10 years of experience in IT and software development. He specializes in digital transformation, working closely with customers to guide the strategic direction of Emerson’s product portfolio.Mr.Fazackerley studiedcomputing and Applied ICTatCentral Sussex College.
REFERENCES
- Wikipedia contributors. (2023, Oct.4). Baryte. In Wikipedia, The FreeEncyclopedia. Retrieved 09:13, Nov.6, 2023, fromhttps://en.wikipedia.org/w/index.php?title=Baryte&oldid=1178568925
- L. J. D. K. Clarke, “Continuousmonitoring delivers insight on corrosion caused by changing sulphur content crudes”, CORROSION 2017, paper no.9063,” Horsham, UK, 2017.
About The Author