Gold (XAU/USD) enters a bearish consolidation phase during the first half of the European session on Thursday and currently trades around the $4,000 psychological mark. The commodity, however, sticks to its bearish bias for the third straight day – also the sixth in the previous seven – and remains close to the lowest level since November 2025, touched on Wednesday, as traders await the crucial US inflation data. The closely watched US Personal Consumption Expenditures (PCE) Price Index will dictate the Federal Reserve’s (Fed) policy path and, in turn, will affect the non-yielding bullion.
In the meantime, inflation fears have receded recently as Crude Oil prices have fallen significantly following the reopening of the Strait of Hormuz. Furthermore, a temporary 60-day sanctions waiver that authorizes the production, delivery, and sale of Iranian crude oil, petroleum, and petrochemical products dragged the black liquid to its lowest level since before the US-Iran war. This should alleviate upstream pressure on consumer inflation, forcing traders to scale back their bets on Fed interest rate increases. The resultant decline in US Treasury bond yields caps any further appreciation of the US Dollar (USD), though it does little to provide any respite to the Gold.
According to CME Group’s FedWatch Tool, market participants are still pricing in over an 80% chance that the US central bank will raise borrowing costs by the end of this year, which should help limit any meaningful USD fall. Meanwhile, a global selloff in technology stocks earlier this week continues to weigh on investors’ sentiment and should also support the safe-haven Greenback. This, in turn, backs the case for a further near-term depreciation of the Gold price, suggesting that any attempted recovery could be sold into and remain capped. Moreover, acceptance below the $4,000 psychological mark validates the negative outlook for the precious metal.
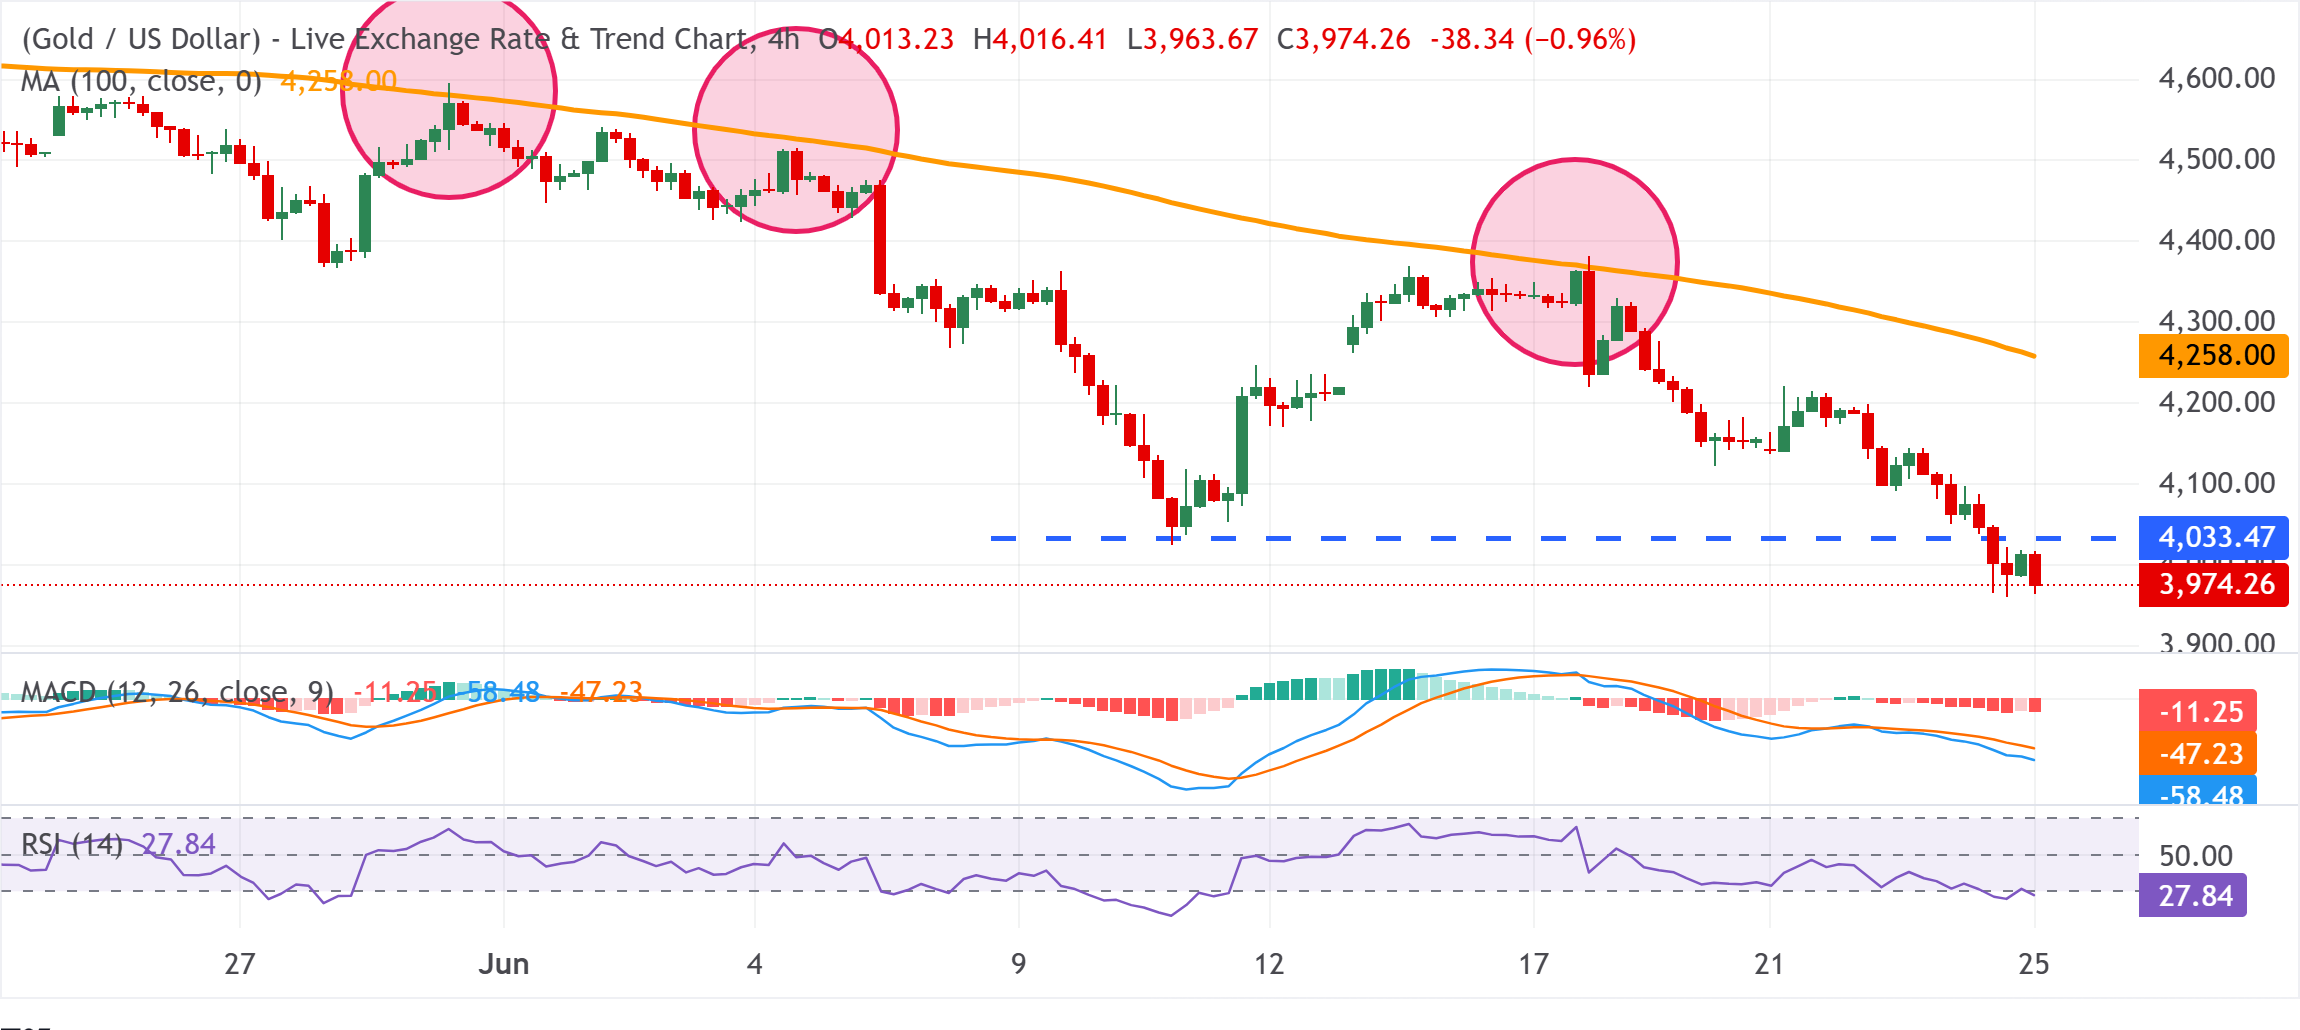
XAU/USD 4-hour chart
Gold bears pause for a breather amid oversold conditions; downside potential intact
Against the backdrop of the recent repeated failures near the 100-period Simple Moving Average (SMA) on the 4-hour chart, the overnight break below the previous year-to-date low and the $4,000 mark were seen as a fresh trigger for the XAU/USD bears. That said, the Relative Strength Index (14) hovers near oversold territory around 28, suggesting that the pace of the decline could slow. Hence, it will be prudent to wait for some near-term consolidation or a modest bounce before positioning for deeper losses.
Meanwhile, the negative Moving Average Convergence Divergence (MACD) reading below zero and its recent deterioration suggest that any rebounds may struggle while the XAU/USD pair trades well beneath the 100-period SMA near $4,258.00. In the meantime, any meaningful recovery beyond the $4,000 mark might now attract fresh sellers near the $4,065-$4,070 region. This should cap the XAU/USD pair near the $4,100 mark. Bulls would need to clear the said barrier to ease immediate bearish pressure and open the door to a more sustained move higher to the 100-period SMA cap.
(The technical analysis of this story was written with the help of an AI tool.)
Economic Indicator
Core Personal Consumption Expenditures – Price Index (YoY)
The Core Personal Consumption Expenditures (PCE), released by the US Bureau of Economic Analysis on a monthly basis, measures the changes in the prices of goods and services purchased by consumers in the United States (US). The PCE Price Index is also the Federal Reserve’s (Fed) preferred gauge of inflation. The YoY reading compares the prices of goods in the reference month to the same month a year earlier. The core reading excludes the so-called more volatile food and energy components to give a more accurate measurement of price pressures.” Generally, a high reading is bullish for the US Dollar (USD), while a low reading is bearish.