Gold (XAU/USD) trades on the back foot on Tuesday, pressured by a stronger US Dollar (USD) and rising expectations that the Federal Reserve (Fed) could raise interest rates later this year.
At the time of writing, XAU/USD is trading around $4,130 after briefly slipping below the $4,100 mark earlier in the day.
Gold bulls remain on the sidelines as prospects of higher interest rates in the US are driving demand for the US Dollar and Treasury yields, following last week’s hawkish Fed meeting, where Chair Kevin Warsh reiterated the central bank’s commitment to returning inflation to its 2% target.
The Fed’s hawkish stance provided fresh support for the Greenback, even as easing tensions in the Middle East pushed Oil prices lower and reduced fears of a sustained inflationary shock.
The US Dollar Index (DXY), which tracks the Greenback’s value against a basket of six major currencies, is hovering around 101.35, its highest level since May 2025.
The combination of a firmer US Dollar and higher Treasury yields is keeping the precious metal in a correction phase after a remarkable two-year rally fueled by geopolitical tensions, central bank buying and Fed rate cuts. XAU/USD is now down nearly 25% from the all-time high near $5,600 reached in January.
What’s next for Gold?
Attention now turns to this week’s US Personal Consumption Expenditures (PCE) inflation data and the final estimate of first-quarter Gross Domestic Product (GDP), which could provide fresh guidance on the Fed’s policy path.
Preliminary Purchasing Managers Index (PMI) data pointed to continued resilience in the US economy in June. The S&P Global Services PMI rose to 51.3 from 50.7 in May, while the Manufacturing PMI accelerated to 55.7 from 55.1, with both readings beating expectations.
Unless the Fed’s hawkish stance shifts meaningfully, higher-for-longer interest rate expectations are likely to remain a headwind for Gold, which tends to perform best in a low-interest-rate environment. The CME FedWatch Tool shows traders are pricing in a 70% chance of a rate hike at the September meeting.
According to the World Gold Council’s Weekly Markets Monitor, if the US Dollar Index (DXY) sustains its rally above the 100 mark, it could signal an extension of Gold’s downtrend below the $4,000 psychological level.
The council said, “Support would then be seen next at US$3,887/oz-US$3,857/oz, which includes the 38.2% retracement of the entire rise in Gold from the 2015 low where we would look for fresh signs of a potential floor here. Should weakness extend, we would see next major support at the October 2025 high at US$3,500/oz.”
Traders are also closely monitoring ongoing US-Iran negotiations after both sides signed a 60-day Memorandum of Understanding (MoU) last week. Talks appear to be progressing, with Washington temporarily easing sanctions on Iranian oil exports during the negotiating period. However, major sticking points remain, including Iran’s nuclear program and regional security issues involving Israel and Lebanon.
Technical Analysis:
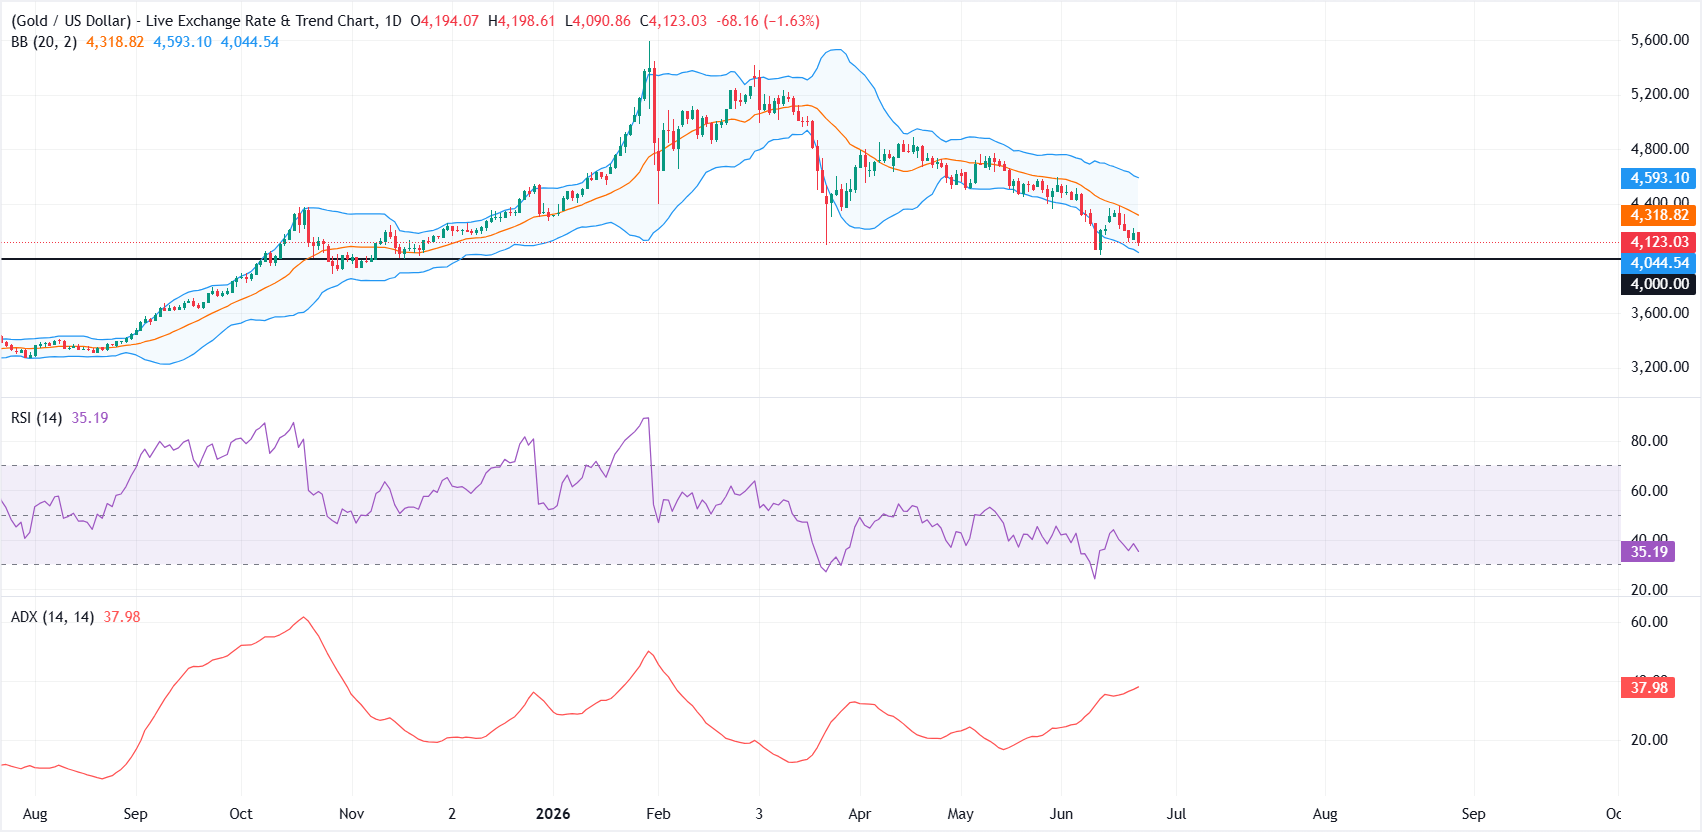
XAU/USD retains a bearish near-term tone as it sits beneath the 20-day Bollinger Simple Moving Average around $4,318.64.
Price action is gravitating toward the lower band support near $4,043.85, while the Relative Strength Index (RSI) on the daily chart lingers in the mid-30s, hinting at persistent downside pressure rather than a decisive oversold capitulation. A rising Average Directional Index (ACX) near 38 suggests the prevailing downtrend remains relatively strong.
On the topside, initial resistance is now aligned with the 20-day Bollinger SMA at roughly $4,318.82, with the upper band near $4,593.10 offering a more distant cap should a corrective bounce develop.
On the downside, the lower Bollinger band around $4,044.54 acts as the first notable floor, ahead of the more psychological and structural horizontal support at $4,000.00, where sellers could be tempted to lock in profits and trigger a short-term pause in the decline.
(The technical analysis of this story was written with the help of an AI tool.)
US Dollar Price Today
The table below shows the percentage change of US Dollar (USD) against listed major currencies today. US Dollar was the strongest against the Australian Dollar.
| USD | EUR | GBP | JPY | CAD | AUD | NZD | CHF | |
|---|---|---|---|---|---|---|---|---|
| USD | 0.33% | 0.24% | -0.06% | 0.21% | 0.94% | 0.61% | 0.12% | |
| EUR | -0.33% | -0.10% | -0.42% | -0.15% | 0.56% | 0.26% | -0.22% | |
| GBP | -0.24% | 0.10% | -0.30% | -0.03% | 0.68% | 0.37% | -0.11% | |
| JPY | 0.06% | 0.42% | 0.30% | 0.26% | 0.99% | 0.67% | 0.17% | |
| CAD | -0.21% | 0.15% | 0.03% | -0.26% | 0.74% | 0.42% | -0.08% | |
| AUD | -0.94% | -0.56% | -0.68% | -0.99% | -0.74% | -0.29% | -0.80% | |
| NZD | -0.61% | -0.26% | -0.37% | -0.67% | -0.42% | 0.29% | -0.51% | |
| CHF | -0.12% | 0.22% | 0.11% | -0.17% | 0.08% | 0.80% | 0.51% |
The heat map shows percentage changes of major currencies against each other. The base currency is picked from the left column, while the quote currency is picked from the top row. For example, if you pick the US Dollar from the left column and move along the horizontal line to the Japanese Yen, the percentage change displayed in the box will represent USD (base)/JPY (quote).