- Gold price drops to a multi-day low on Monday amid modest USD strength.
- Fed rate cut bets and US fiscal concerns should act as a headwind for the USD.
- Geopolitical risks could further offer support to the safe-haven precious metal.
Gold price (XAU/USD) maintains its offered tone heading into the European session on Monday, albeit managing to hold above the $3,300 round figure amid mixed cues. The US Dollar (USD) regains positive traction and moves back closer to last week’s swing high, which, in turn, is seen as a key factor undermining the commodity. However, bets that the Federal Reserve (Fed) will resume its rate-cutting cycle in the near future should keep a lid on the USD and lend support to the non-yielding yellow metal.
Meanwhile, investors remain worried that US President Donald Trump’s massive tax-cut and spending bill would worsen America’s long-term debt problems. Adding to this, fresh Israeli strikes on Yemen in almost a month and the uncertainty over Trump’s erratic trade policies take their toll on the global risk sentiment. This further contributes to limiting losses for the safe-haven Gold price. Traders now look to the FOMC meeting minutes on Wednesday for cues about the Fed’s rate-cut path and a fresh impetus.
Daily Digest Market Movers: Gold price bulls remain on the sidelines amid a broadly stronger USD
- The US Dollar kicks off the new week on a slightly positive note and weighs on the Gold price, though the downside potential seems limited amid a combination of supporting factors.
- US President Donald Trump’s ‘One Big Beautiful Bill’ is now a law and is expected to add $3.4 trillion to the nation’s debt over the next decade, worsening the long-term debt problem.
- This comes amid worries about the potential economic fallout from Trump’s reciprocal tariffs and dovish Federal Reserve bets, which should keep a lid on any meaningful USD strength.
- Trump said on his social media early this Monday that the US tariff letters, and/or deals, with various countries from around the world, will be delivered starting 12:00 P.M. on July 7th.
- Trump followed up with a warning, stating that any country aligning with the anti-American policies of BRICS will be charged an additional 10% tariff and there will be no exceptions to this policy.
- Traders are currently pricing in over a 70% chance that the US central bank would lower borrowing costs in September and deliver at least two 25 basis points rate reductions by the year-end.
- The Israeli military carried out intense strikes on Houthi targets in three Yemeni ports and a power plant early this Monday in response to repeated attacks by the Iran-aligned group on Israel.
- This keeps geopolitical risks in play and should offer some support to the safe-haven precious metal. Traders now look to the release of FOMC minutes on Wednesday for a fresh impetus.
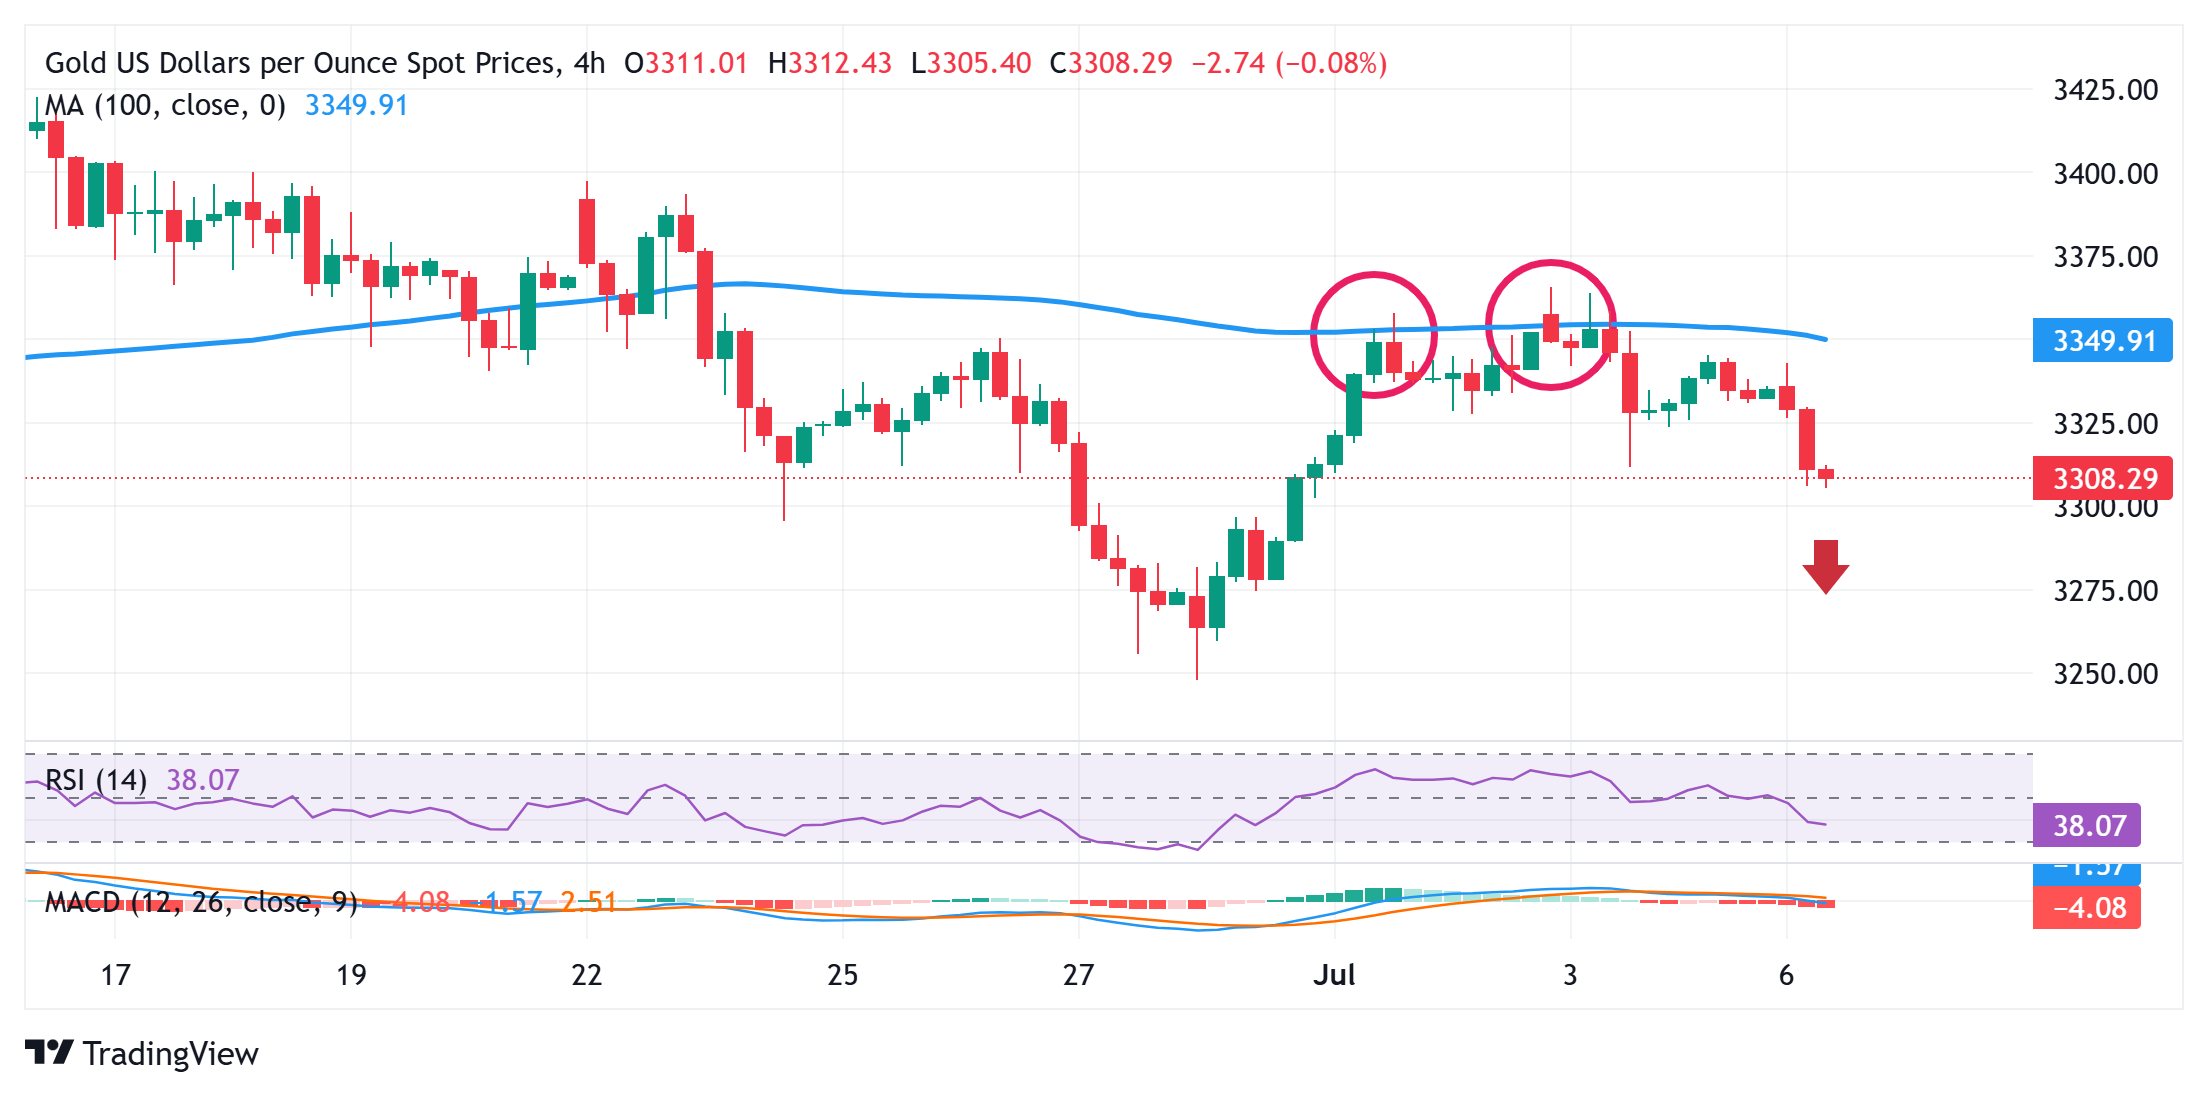
Gold price needs to find acceptance below $3,300 for bears to seize near-term control

The recent repeated failures to build on momentum beyond the 100-period Simple Moving Average (SMA) on the 4-hour chart and the subsequent fall below the $3,300 mark will be seen as a fresh trigger for the XAU/USD bears. Given that oscillators on the daily chart have just started gaining negative traction, the Gold price might then accelerate the slide to the next relevant support near the $3,270 horizontal zone en route to the $3,248-3,248 region.
On the flip side, the $3,324-3,325 region now seems to act as an immediate hurdle ahead of the $3,342-3,343 zone. Some follow-through buying, leading to a further strength beyond the $3,352-3,355 area, could provide a goodish lift to the Gold price and allow bulls to aim towards reclaiming the $3,400 round figure.
US Dollar PRICE Today
The table below shows the percentage change of US Dollar (USD) against listed major currencies today. US Dollar was the strongest against the New Zealand Dollar.
| USD | EUR | GBP | JPY | CAD | AUD | NZD | CHF | |
|---|---|---|---|---|---|---|---|---|
| USD | 0.26% | 0.37% | 0.64% | 0.37% | 0.89% | 0.94% | 0.24% | |
| EUR | -0.26% | 0.12% | 0.17% | 0.08% | 0.69% | 0.67% | -0.03% | |
| GBP | -0.37% | -0.12% | 0.00% | -0.01% | 0.58% | 0.56% | -0.27% | |
| JPY | -0.64% | -0.17% | 0.00% | -0.05% | 0.46% | 0.51% | -0.34% | |
| CAD | -0.37% | -0.08% | 0.01% | 0.05% | 0.54% | 0.57% | -0.26% | |
| AUD | -0.89% | -0.69% | -0.58% | -0.46% | -0.54% | 0.08% | -0.82% | |
| NZD | -0.94% | -0.67% | -0.56% | -0.51% | -0.57% | -0.08% | -0.82% | |
| CHF | -0.24% | 0.03% | 0.27% | 0.34% | 0.26% | 0.82% | 0.82% |
The heat map shows percentage changes of major currencies against each other. The base currency is picked from the left column, while the quote currency is picked from the top row. For example, if you pick the US Dollar from the left column and move along the horizontal line to the Japanese Yen, the percentage change displayed in the box will represent USD (base)/JPY (quote).