Dogecoin (DOGE) edges above the daily open, trading above $0.070 as of Thursday. While this uptick offers a positive signal, DOGE continues to trade within a broader bearish context, down approximately 12% from its July peak of $0.079.
Still, should the $0.070 support level hold, the mild recovery could gather pace, targeting resistance at $0.080 and potentially the key $0.100 threshold.
Dogecoin whales accumulate despite lackluster price action
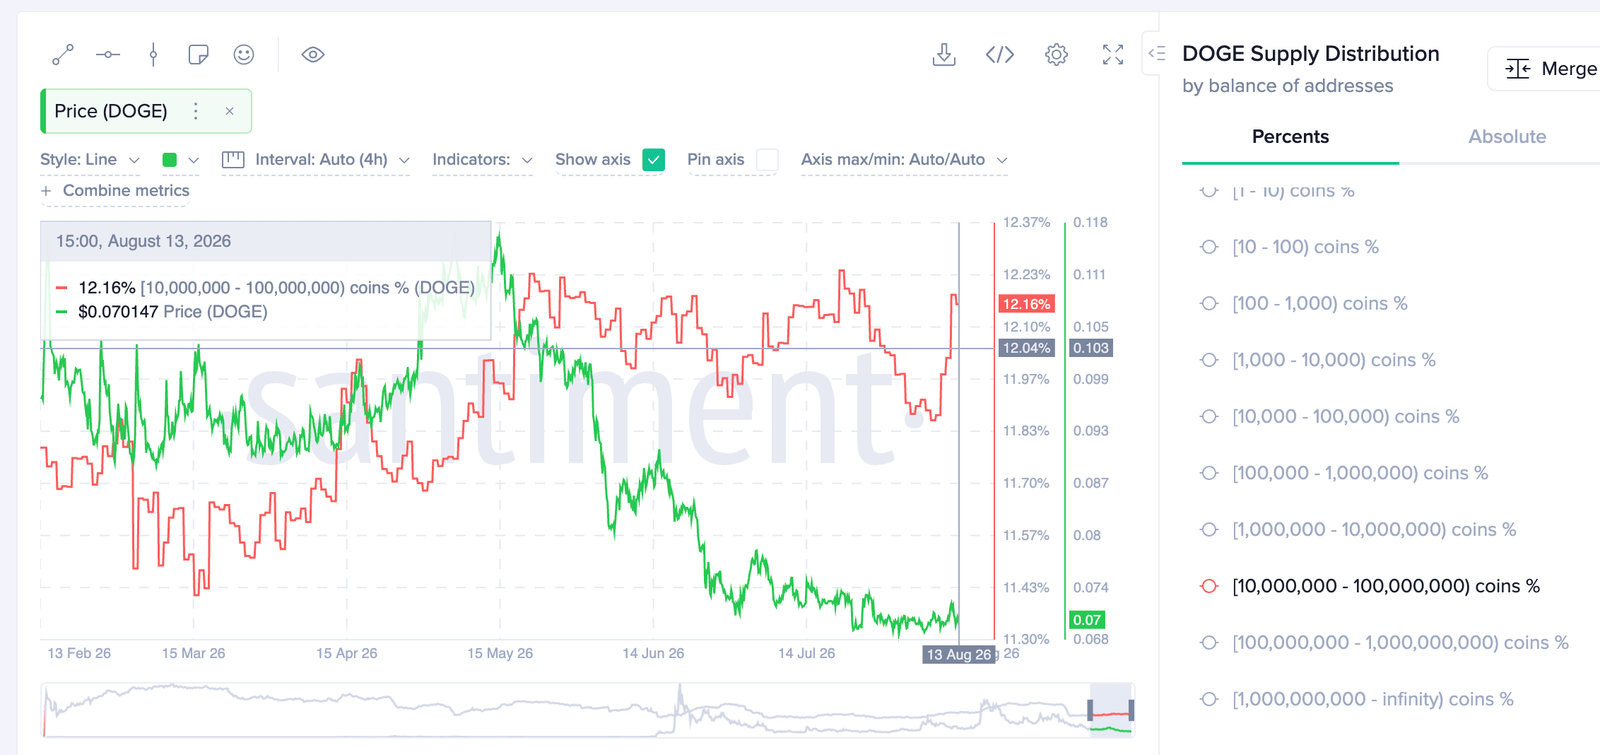
Whales are showing interest in the largest meme coin, with wallets holding between 10 million and 100 million DOGE now accounting for over 12.18% of the total circulating supply as of Wednesday, up from 11.86% last Saturday.
This increase in demand is unfolding against a backdrop of broader market stagnation and recent weakness in Dogecoin’s price. If accumulation persists, whale activity could help absorb selling pressure and support a sustained uptrend.
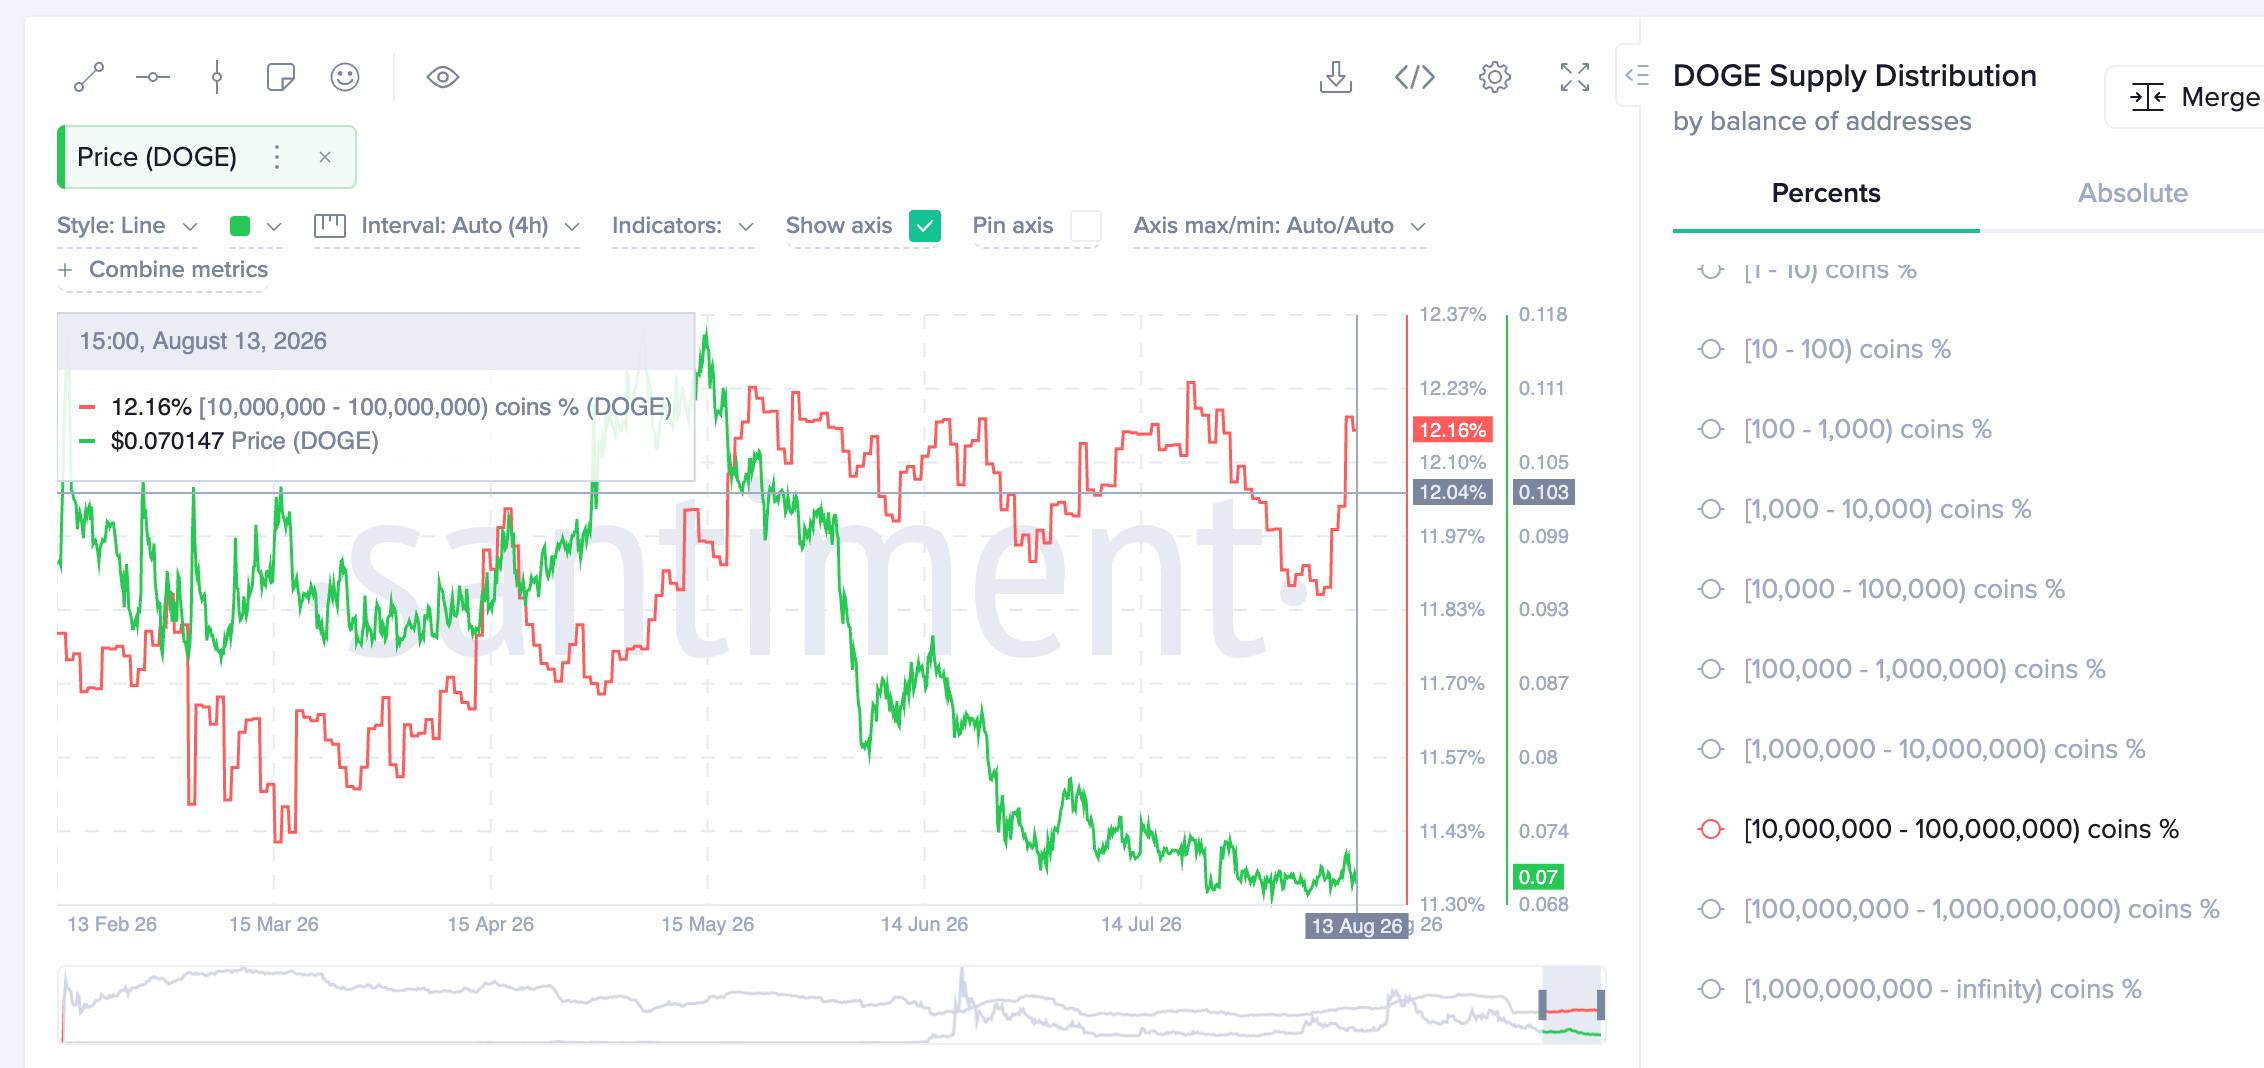
Meanwhile, retail demand remains relatively elevated, as reflected in perpetual futures Open Interest (OI), which averages 17 billion DOGE on Thursday, down only marginally from 17.23 billion DOGE the day before.
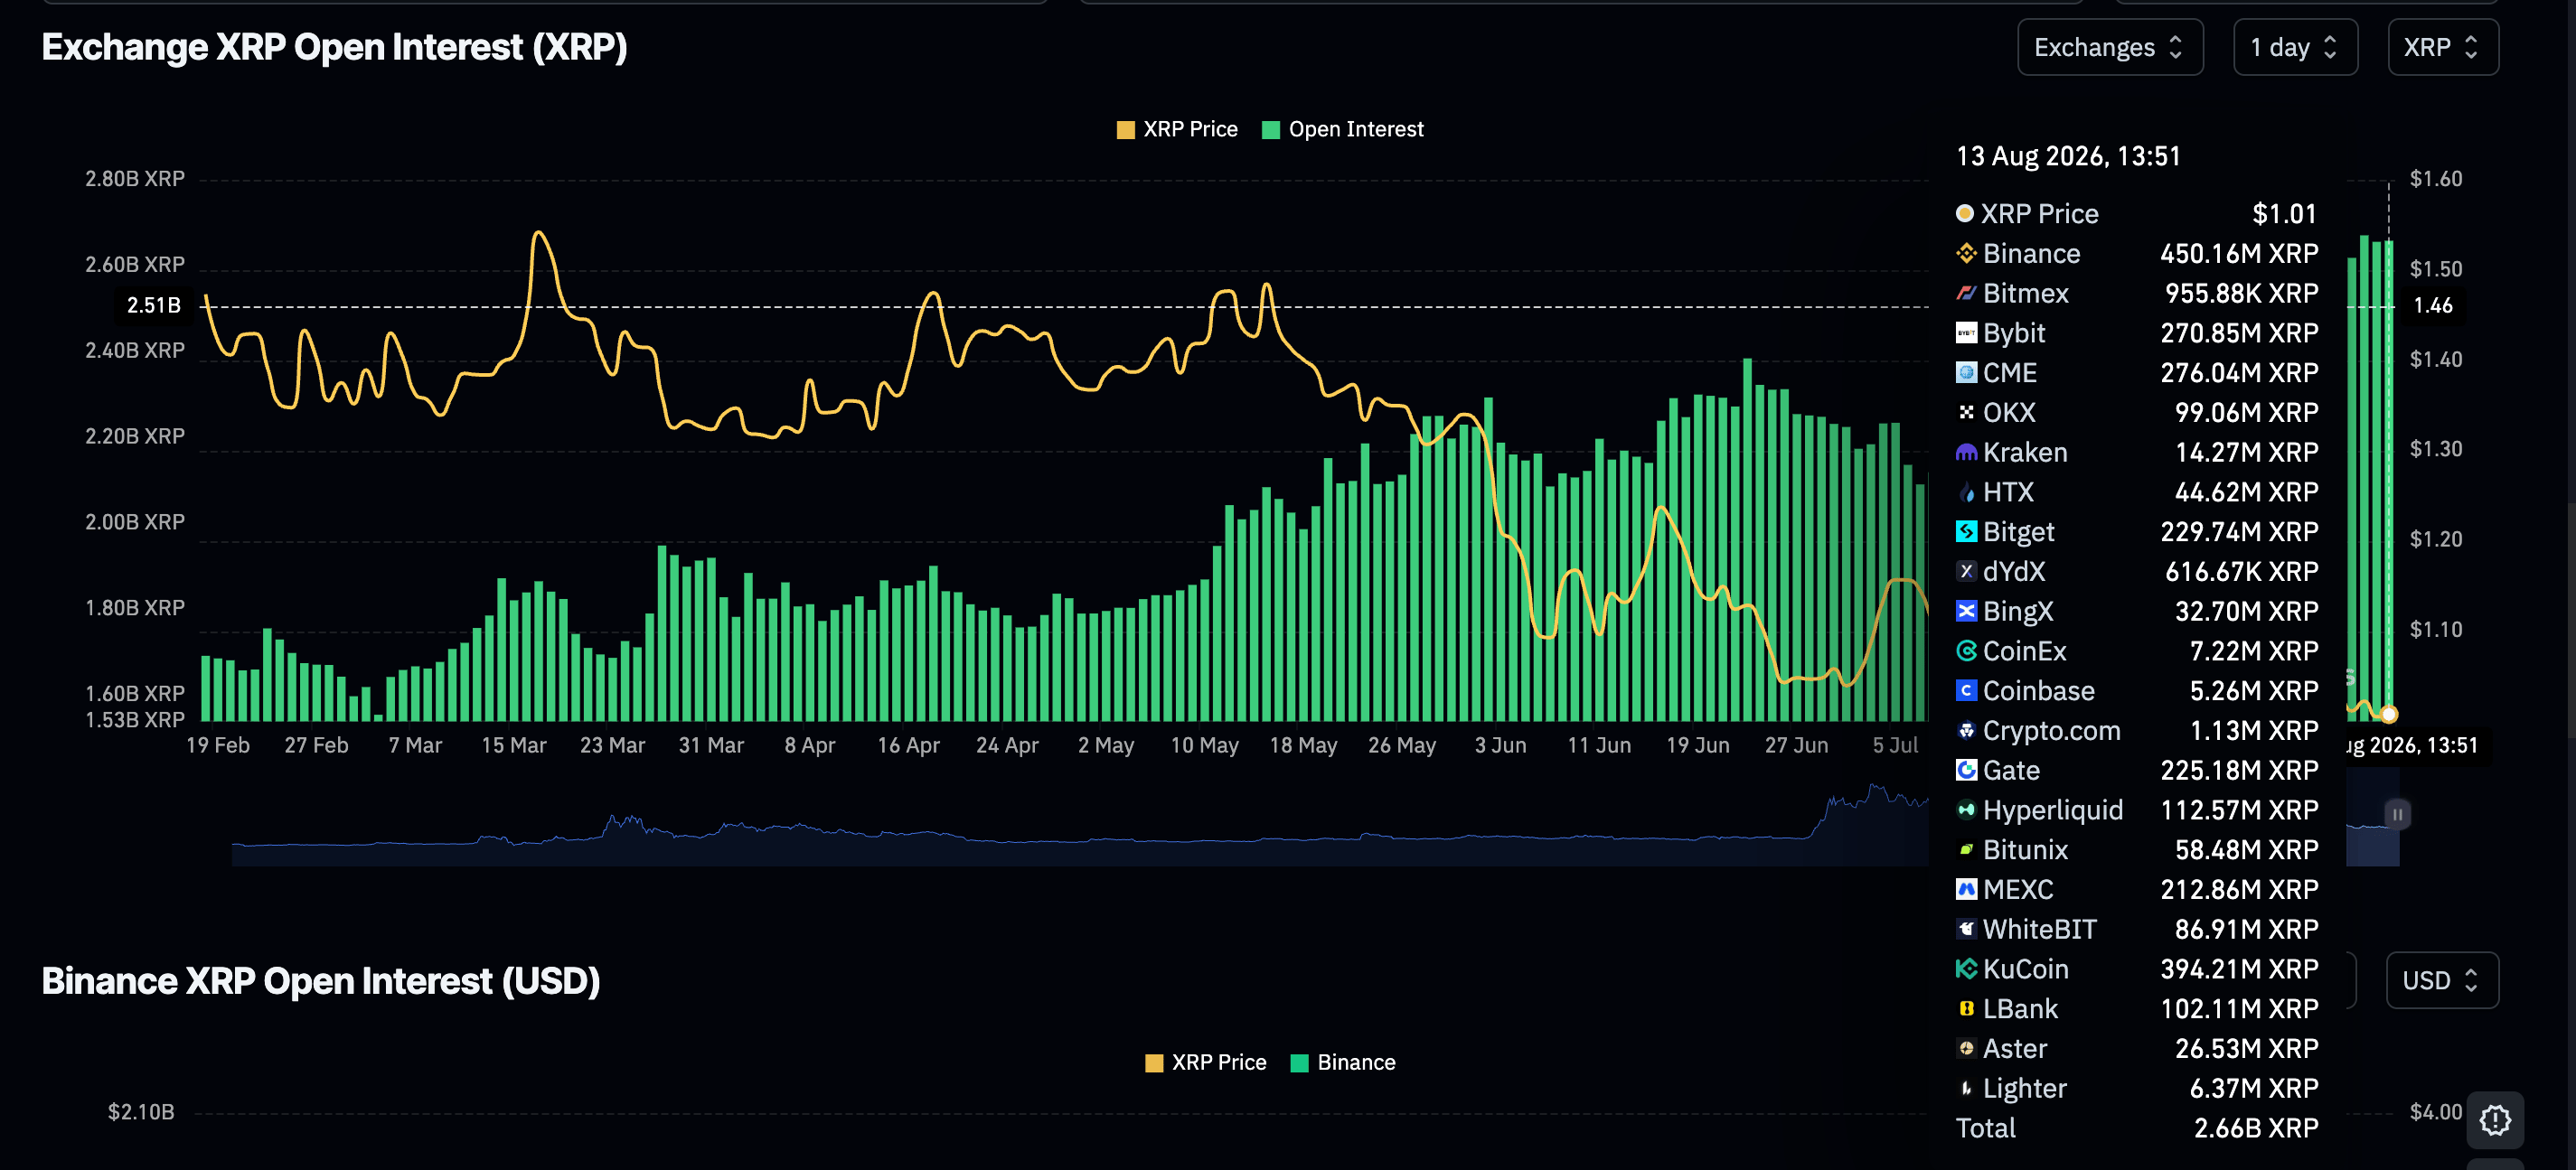
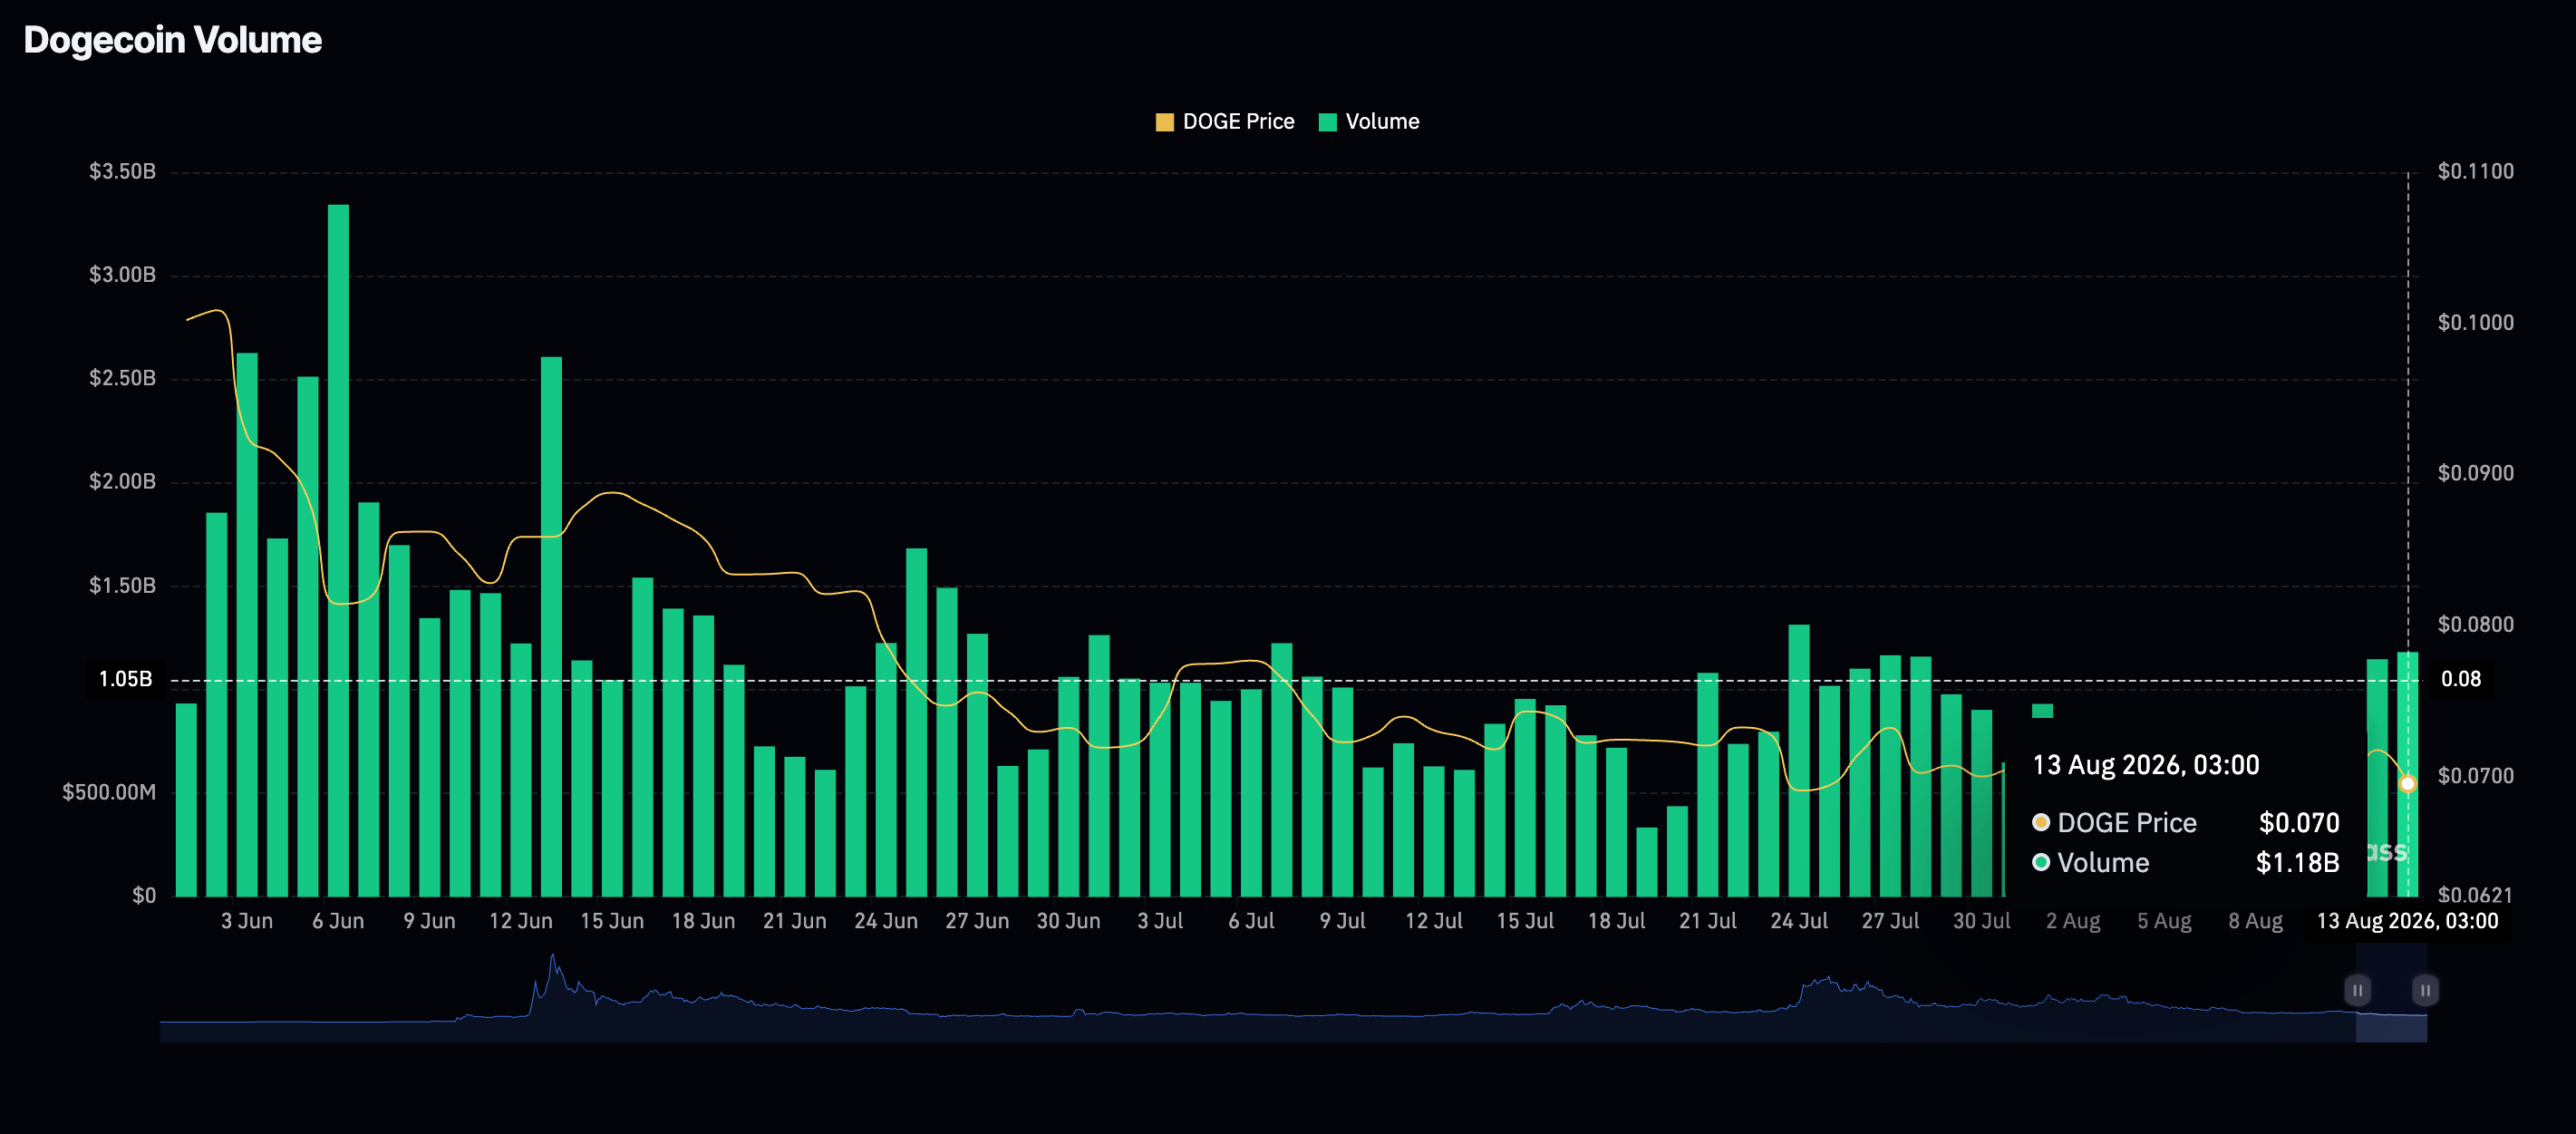
The token’s trading volume has increased to $1.18 billion, nearly doubling the $689 million recorded on Tuesday. Increasing OI alongside the volume reinforces Dogecoin’s short-term outlook, supported by risk-on sentiment.
Technical Analysis: Dogecoin eyes breakout above key support
Dogecoin trades above $0.070, but remains under a dense confluence of moving averages, keeping the near-term bias bearish despite the recent stabilization. The spot price remains anchored just below the Bollinger Bands’ midline at $0.070. The Relative Strength Index (RSI) hovers around 47, and the Moving Average Convergence Divergence (MACD) is printing modestly positive signals, indicating a gradual uptick in momentum that still falls short of reversing the broader structural downtrend.
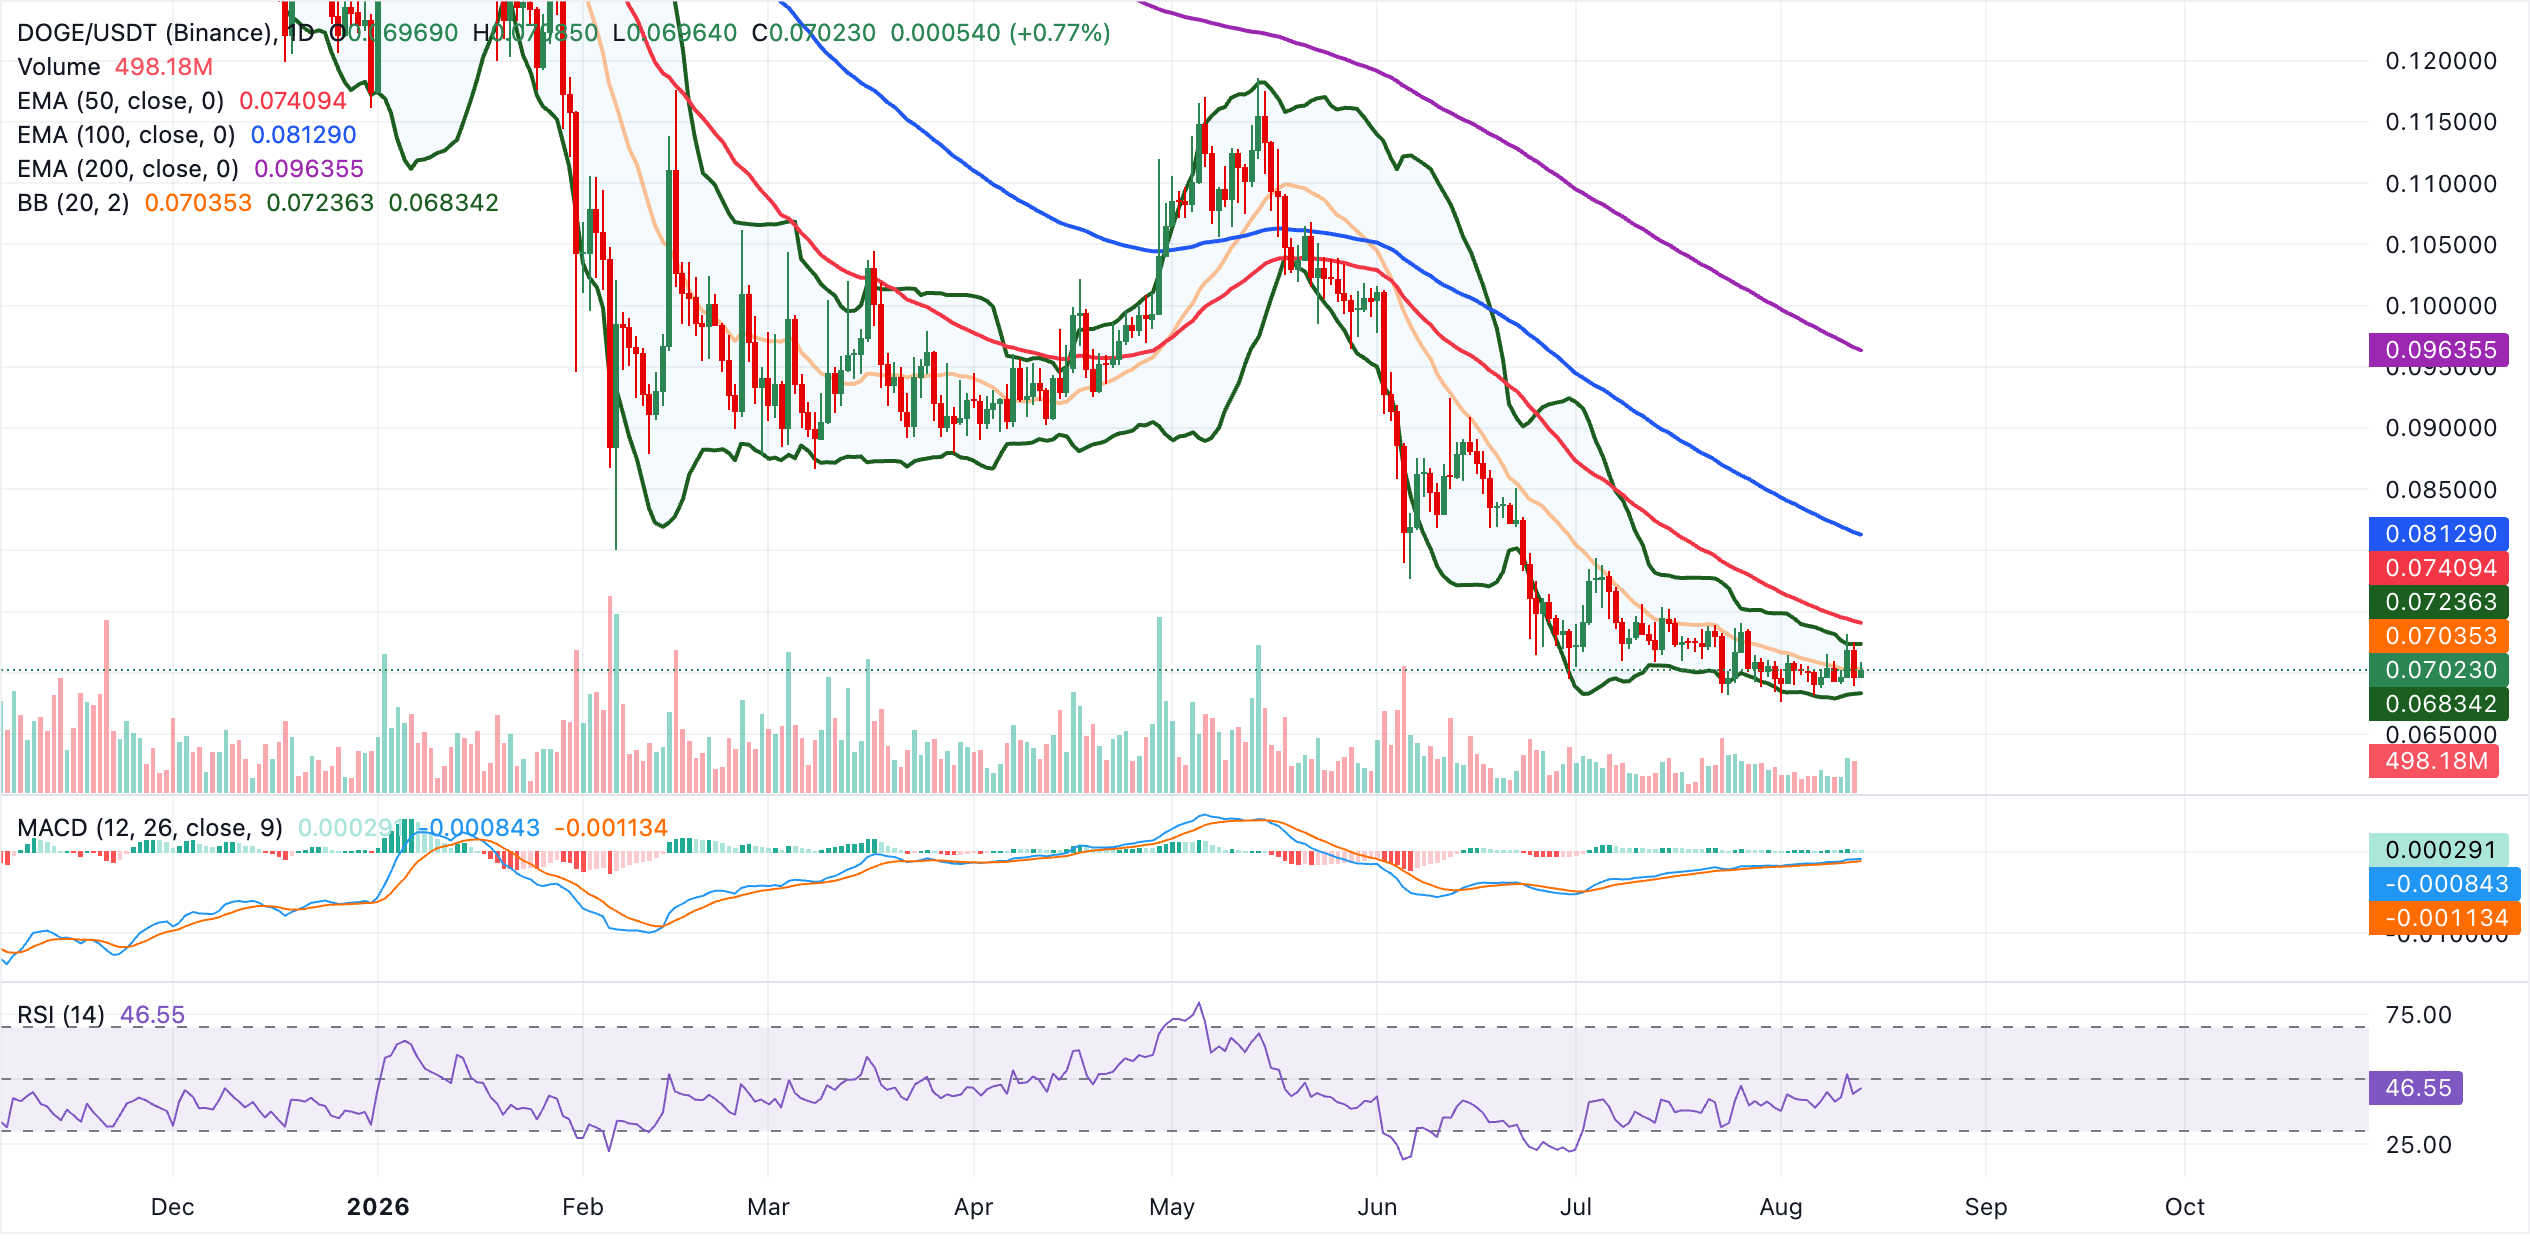
Initial resistance is seen at the Bollinger Bands’ middle layer at $0.070, followed by the upper boundary near $0.072, where short-term rallies could stall. Above that, the 50-day EMA at $0.074 forms the next cap, with more substantial barriers emerging at the 100-day EMA at $0.081 and the 200-day EMA at $0.096. On the downside, the lower Bollinger Band at $0.068 offers the first meaningful support area. A daily close below this level would open the door to renewed selling pressure and a potential extension of the bearish phase.
(The technical analysis of this story was written with the help of an AI tool. Know more.)
Cryptocurrency metrics FAQs
About The Author