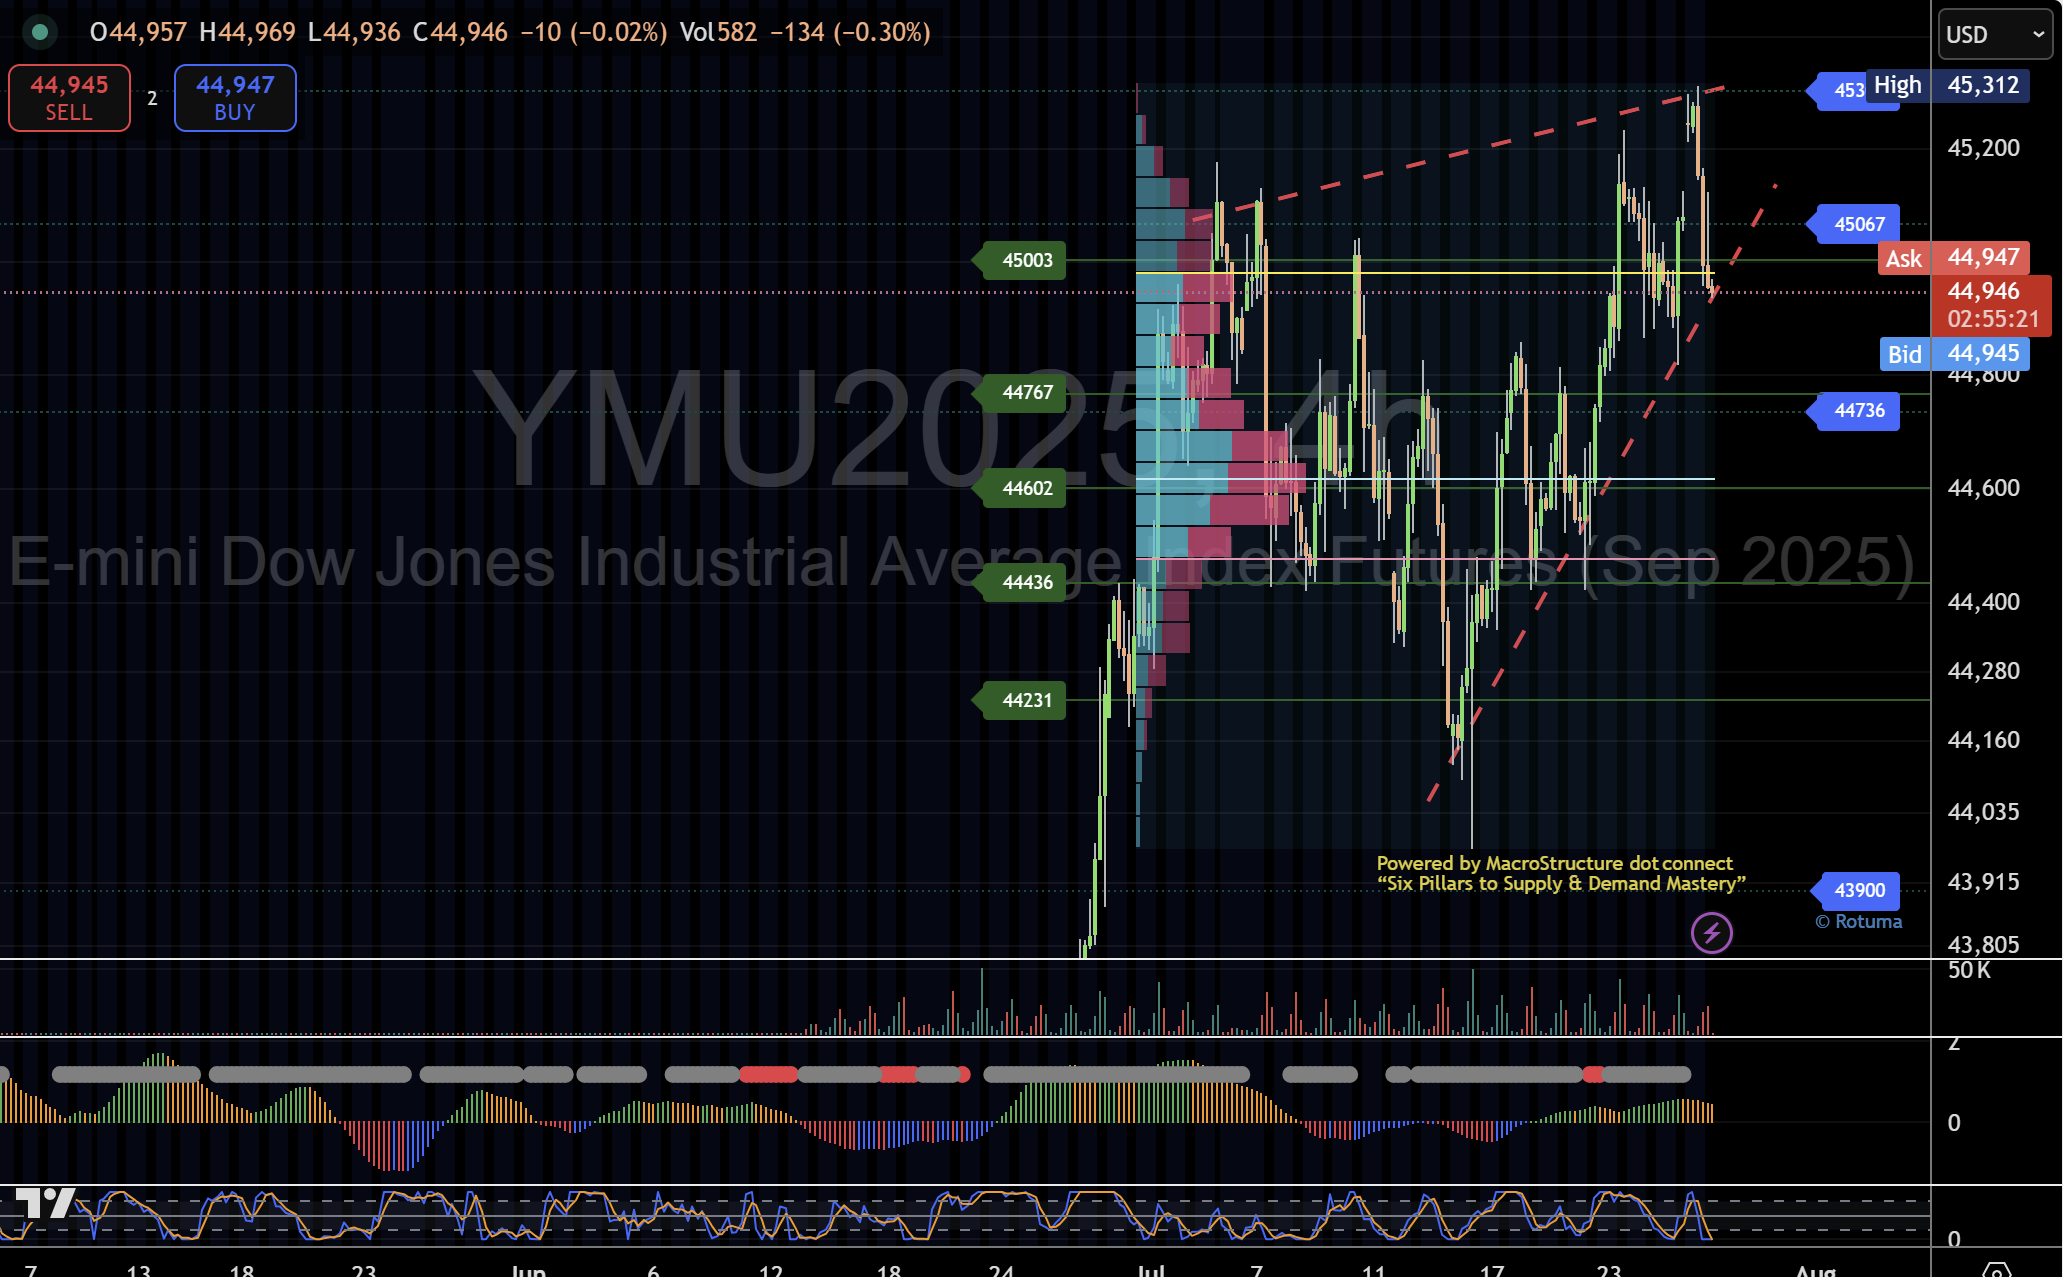
E‑mini Dow battles within a contracting up‑channel—failure to hold the lower trendline could trigger a swift slide toward 44,602 and 44,436, while only a decisive break above 45,303will invalidate the bearish setup.
1. Rising Wedge Pattern Overview
- Structure: Price has been pushing higher within two converging, upward‑sloping trendlines (red dashed).
- Volume Profile: Notice declining volume at each new high—classic for a rising wedge.
- Bias: A rising wedge in an uptrend often signals slowing momentum and an eventual bearish reversal.
2. Bearish Breakdown Scenario
- Trigger: Close below the lower trendline (currently ~44,900) on a daily or 4‑hour close.
- Immediate Target: 44,602 – confluence of the last Value Area Low and a significant volume‐node.
- Secondary Targets:
- 44,436 – recent low within the wedge base.
- 44,231 – gap fill area and prior low–volume region.
- 43,900 – the weekly POC/major support in early July.
- Confirmation: A surge in selling volume and a break of the next micro pivot (e.g., 44,500) will reinforce the bearish case.
3. Bullish Invalidated Scenario
- Invalidation: A decisive break and hold above the upper trendline (~45,303) on strong volume.
- Upside Target: 45,600–45,800 – previous swing high zone and upper channel boundary.
- Risk: If volume does not accompany the breakout, beware of a false break and quick reversal back into the wedge.

4. Entry & Exit Guidelines
- Short Entry:
- Wait for a daily close below the lower trendline (≈44,900) with rising volume.
- Enter on a retest of the broken trendline or a fresh break below micro pivot 44,850.
- Stop‑Loss:
- Place just above the lower trendline retest (≈45,000), or above the last swing high inside the wedge.
- Profit‑Taking:
- Scale out 50% at 44,602, 30% at 44,436, and trail the remainder toward 43,900.
5. Risk Management & Notes
- Position Sizing: Limit risk per trade to 1–2% of account equity.
- Market Context: Monitor US economic data releases and Fed commentary—high-impact events can override pattern setups.
- Alternative Scenarios: If price chops around the lower trendline without conviction, stay flat or use tight ranges for scalps.
Key Levels at a Glance
LevelRole
45,303 Upper trendline resistance
44,900 Lower trendline support (break trigger)
44,602 VAH/Value Area Low (1st bearish target)
44,436 Wedge base support
44,231 Gap-fill, low‑volume node
43,900 Weekly POC, major structural support
Conclusion
The rising wedge on Dow futures signals a potential fading of bullish momentum. A clear break below 44,900 would open a swift move toward 44,602 and lower. Conversely, only a confident breach above 45,303would negate the bearish thesis and point toward the 45,600–45,800 zone. Monitor volume and price action closely for the definitive signal.