![Unlocking the success code: S&P BSE Sensex Index Elliott Wave technical analysis [Video]](https://tradeinzone.in/wp-content/uploads/2025/03/SP500-bullysh-withoutbull_Large.jpg)
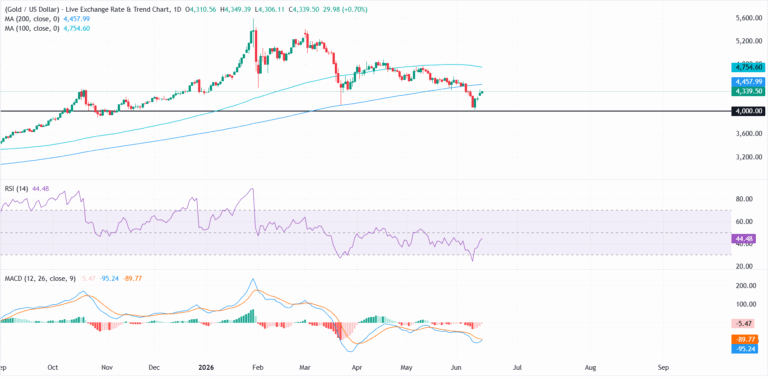
S&P 500 Elliott Wave analysis
-
Function:Counter-Trend.
-
Mode:Impulsive as Wave C.
-
Wave structure:Navy Blue Wave C.
-
Current position:Gray Wave 2.
-
Next higher degree:Gray Wave 3.
S&P 500 Elliott Wave summary – Daily perspective:
The S&P 500 is currently positioned in acounter-trend structure, moving throughnavy blue wave C, which is part of the largergray wave 2. The precedingnavy blue wave Bappears to have ended, paving the way for this current impulsive phase within a broader corrective sequence.
As part of the ongoing correction, thewave Cmovement is anticipated to unfold in an impulsive form. This behavior is typical in the final leg of a correction and may help define the structure’s completion before transitioning intogray wave 3.
Analytical insights:
-
Wave C movements frequently appear as five-wave impulsive patterns and often complete complex corrections.
-
Traders should remain alert for signals of structure completion to time potential re-entries or exits.
-
Understanding the current wave’s role within the broader count enhances both tactical and strategic decision-making.
Trading implications:
This chart setup offers important insights for investors managingnear-term market volatility. As the index continues through this corrective stage, bothshort-term tradesandlonger-term strategiesshould consider the broader wave relationships. Awareness of key structural milestones is essential for navigating price action confidently.
S&P 500 Elliott Waveanalysis
-
Function:Counter-Trend.
-
Mode:Corrective.
-
Wave structure:Navy Blue Wave C.
-
Current position:Gray Wave 2.
-
Next higher degree:Gray Wave 3.
-
Invalidation level:3497.72.
S&P 500 Elliott Wave summary – Weekly perspective:
The S&P 500 is currently engaged in acorrective counter-trend phase, progressing throughnavy blue wave C, which is part of the broadergray wave 2structure. The earliernavy blue wave Bcorrection is now considered complete, signaling the beginning of wave C’s development within this higher-degree framework.
This wave C movement is expected to follow a corrective structure, often characterized bythree-wave formationsorsideways consolidation. The key invalidation point for the current analysis is set at3497.72—a breach of which would nullify the existing wave count.
Analytical insights:
-
Navy blue wave C plays a pivotal role in shaping intermediate market behavior and positioning within gray wave 2.
-
Investors should stay alert for signals marking the end of this corrective leg before considering positions aligned with gray wave 3’s expected direction.
-
The weekly time frame allows for a broader view, supporting both short-term assessments andstrategic long-term positioning.
Trading implications:
This setup supports a measured approach forposition tradersandlong-term investors, as the index completes a transitional phase within its larger cycle. Monitoring wave characteristics is key to validating the unfolding structure and preparing for the potential transition into gray wave 3.
Technical analyst:Malik Awais.