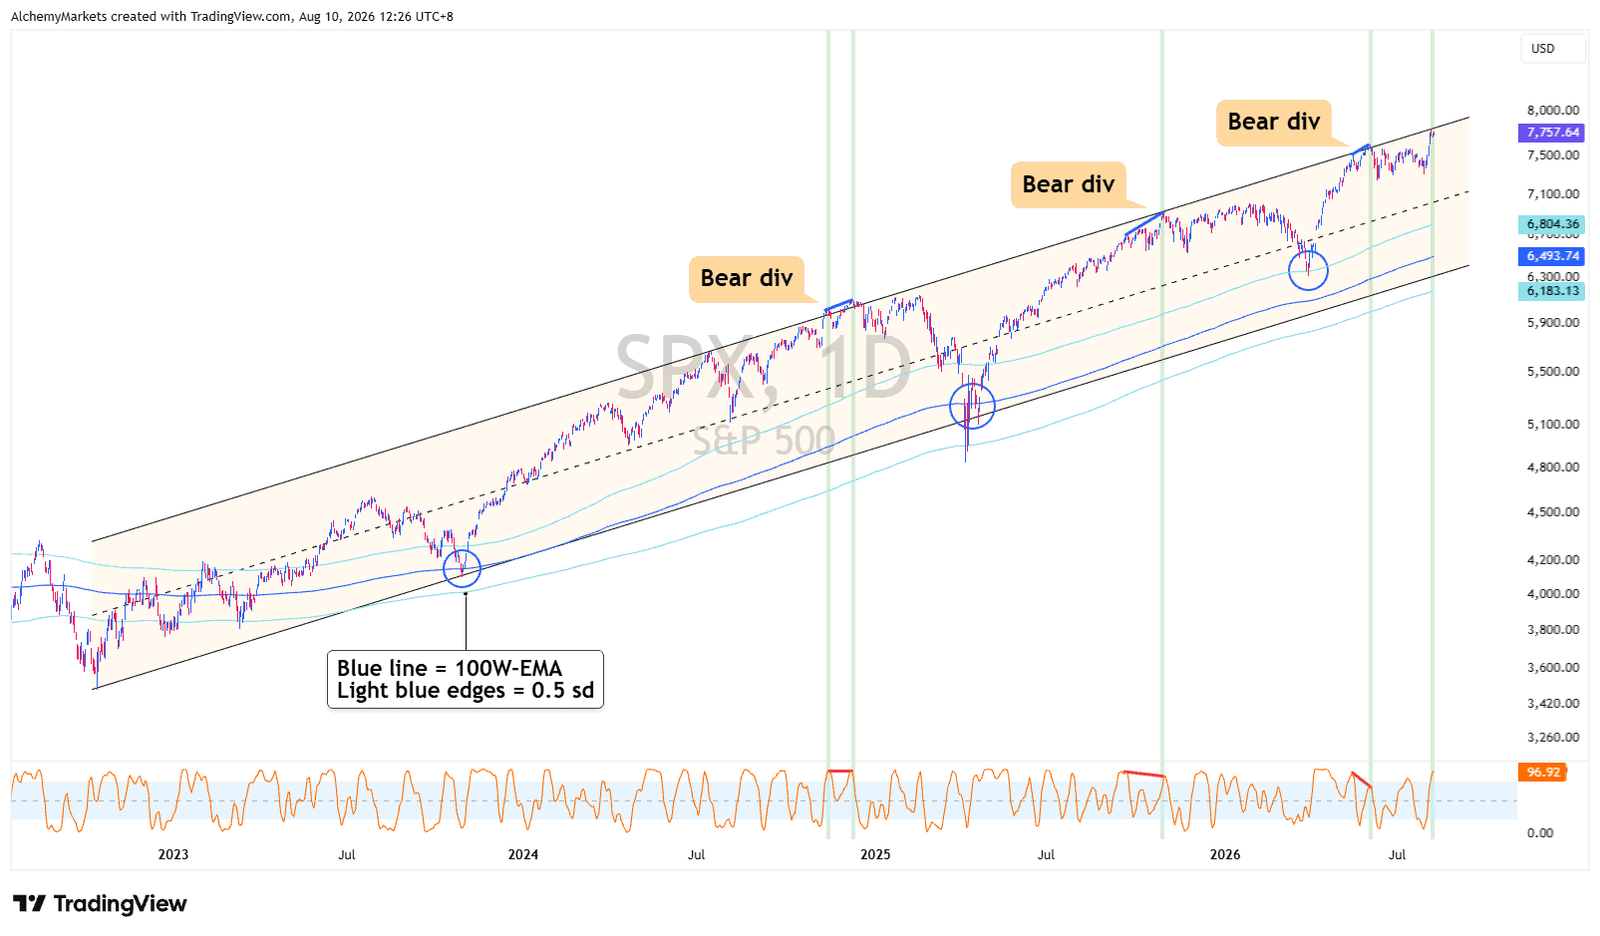
The S&P 500 is now testing the top of a logarithmic rising channel stretching back to 2022, while Stochastic RSI has pushed into overbought territory.
Previous tests of this top has resulted in a bearish divergence on the daily timeframe, where price continued to push higher with weakening momentum. This was eventually followed by a decline.
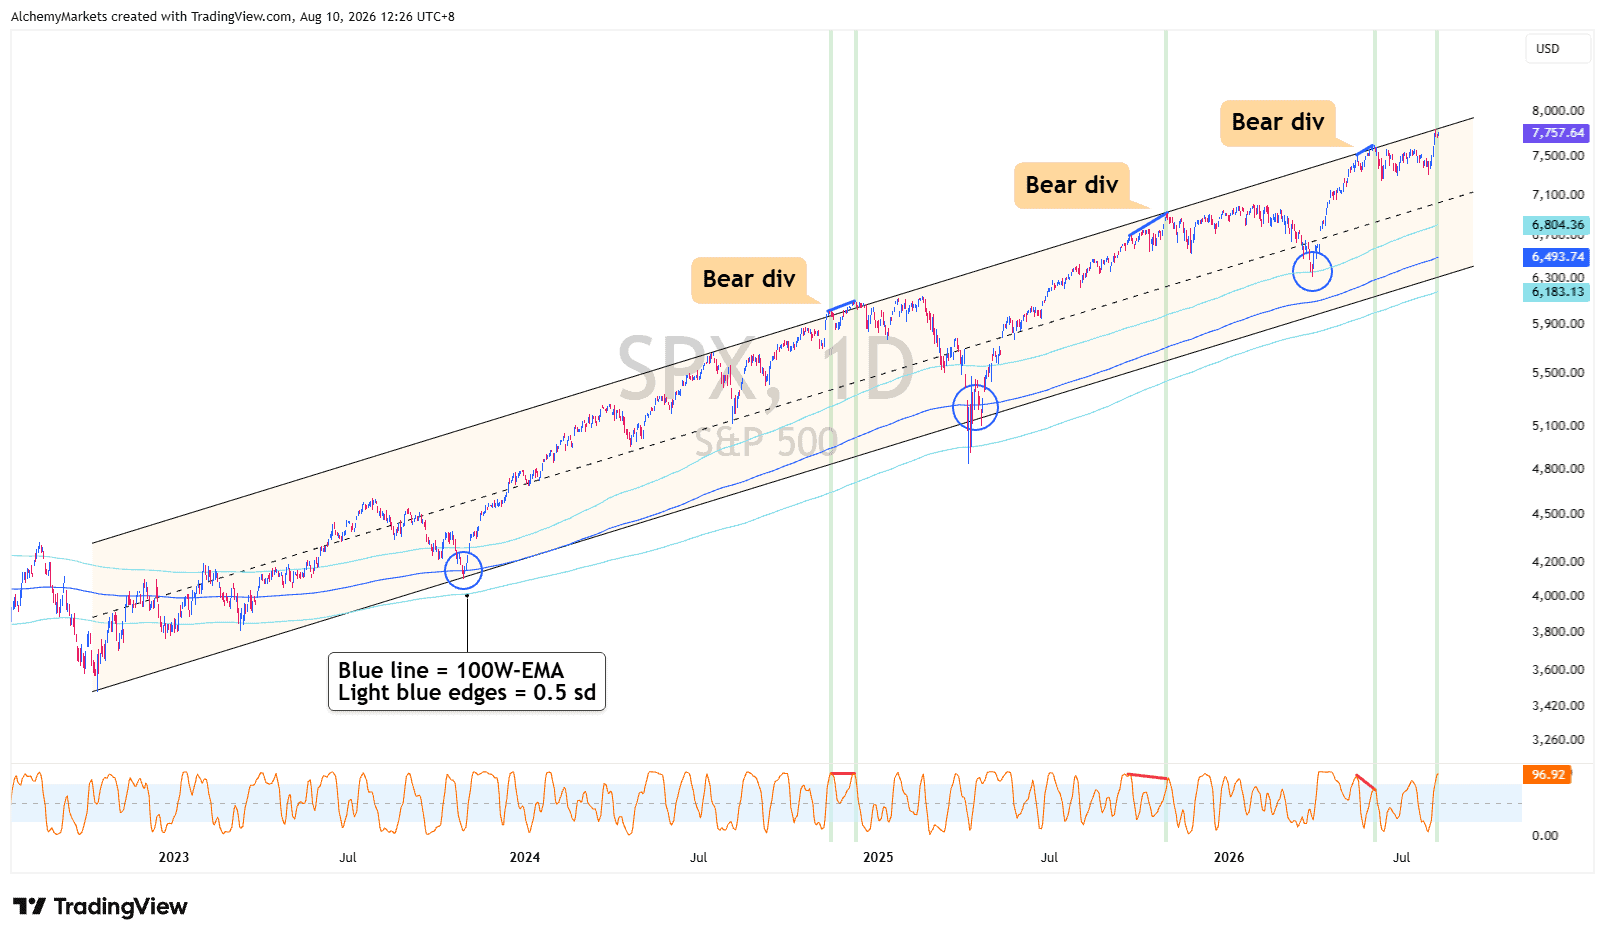
So if price pushes higher and forms a bearish divergence now, this technical idea is going to gain more probability for me, personally.
Those pullbacks have repeatedly brought the S&P back towards its 100-week EMA band, which has acted as a pretty reliable trend support since 2023. It currently sits near the channel lows
What would get my attention?
I would want to see something like this:
- S&P continues pushing higher, potentially even overshooting the channel.
- Stochastic RSI fails to confirm the new high, creating daily TF bearish divergence.
- Price then falls back inside the channel.
If that happens, the topping idea becomes much more interesting.
For now, we’re only at the awareness stage.
The setup is there, but the actual reversal signal isn’t.
Bullish scenario
If you’re an Elliott Wave trader, the current move could still be part of Wave 3, which would leave room for the S&P to break above this channel and extend considerably higher before a larger correction develops.
A sustained breakout above the channel would therefore weaken my bearish idea pretty quickly.
Keep in mind, we’re not trying to pick the top here. This is simply a technical structure worth paying attention to as it has produced some pretty useful signals over the last few years.
For now: Channel resistance is being tested. I remain neutral until I see a bearish divergence, or a sustained break above the channel.
About The Author