Executive summary
Bullish trend:SPX continues in the 3rd wave higher.
Potential target:$7,000 using Fibonacci extension and round number resistance.
Wave count:Still no sight of wave 4 decline.
Current Elliott Wave analysis
The SPX chart follows an incompleteElliott Waveimpulse patternas the market continues its climb in wave ((iii)).
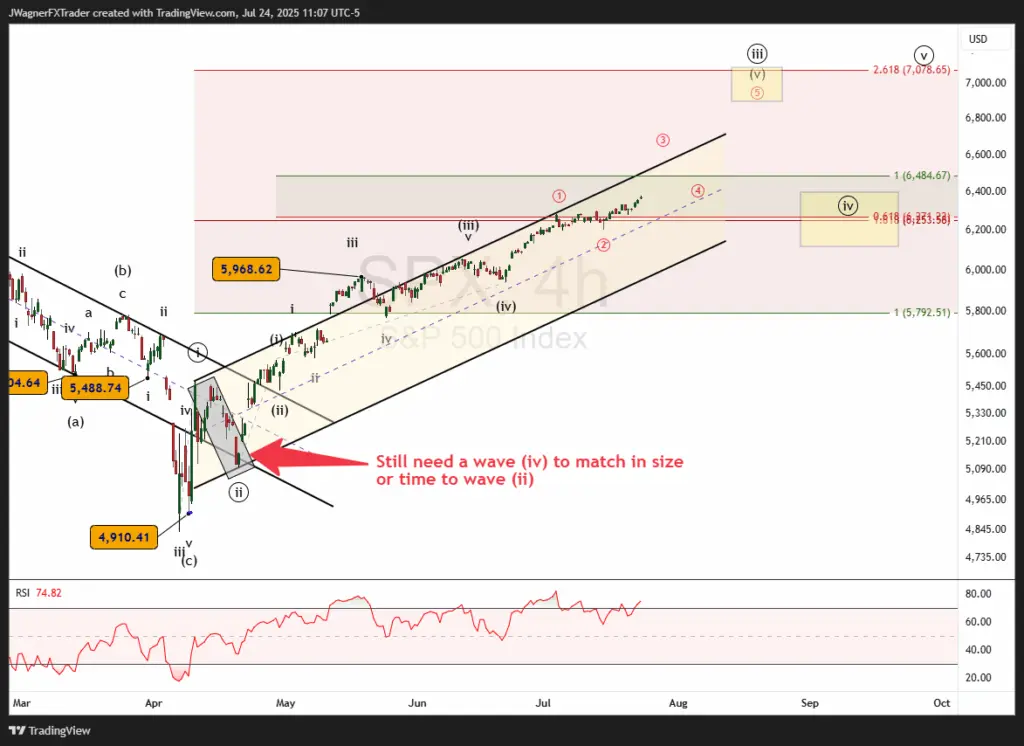
It appears SPX is still working higher in wave (v) of ((iii)). We can feel confident about this wave labeling because within an impulse, waves 2 & 4 are cousin waves. They tend to experience similar depths.
Once SPX bottomed in April, the largest interruption of the rally was wave 2 at 7 days long and about 7% in price.
Since April 21, the next largest decline was 3.5% or about half of the depth of what the market experienced in April. Therefore, we can confidently conclude that the cousin wave to wave ((ii)) has not arrived yet.
With some reverse engineering, we can then conclude that the recent rally is still simply wave ((iii)). When the next decline arrives, anticipate about a 5-8% haircut and we’ll label that as wave ((iv)) so it can match up with wave ((ii)).
How high might the current rally travel?
There is a wave relationship up near $7,000 where wave ((iii)) is a2.618 Fibonacci extensionof wave ((i)). Additionally, there existsround number resistance. Therefore, we are forecasting a wave ((iii)) top within the next 10%.
Once the wave ((iii)) top is in place, then wave ((iv)) likely travels to 6,300-6,650.
Bottom line
SPX remains in a strongbullish uptrendlabeled wave ((iii)). The bullish pattern remains incomplete and may carry up to $7,000 with the next decline, wave (iv) anticipated to remain soft at 5-7%.