Overview
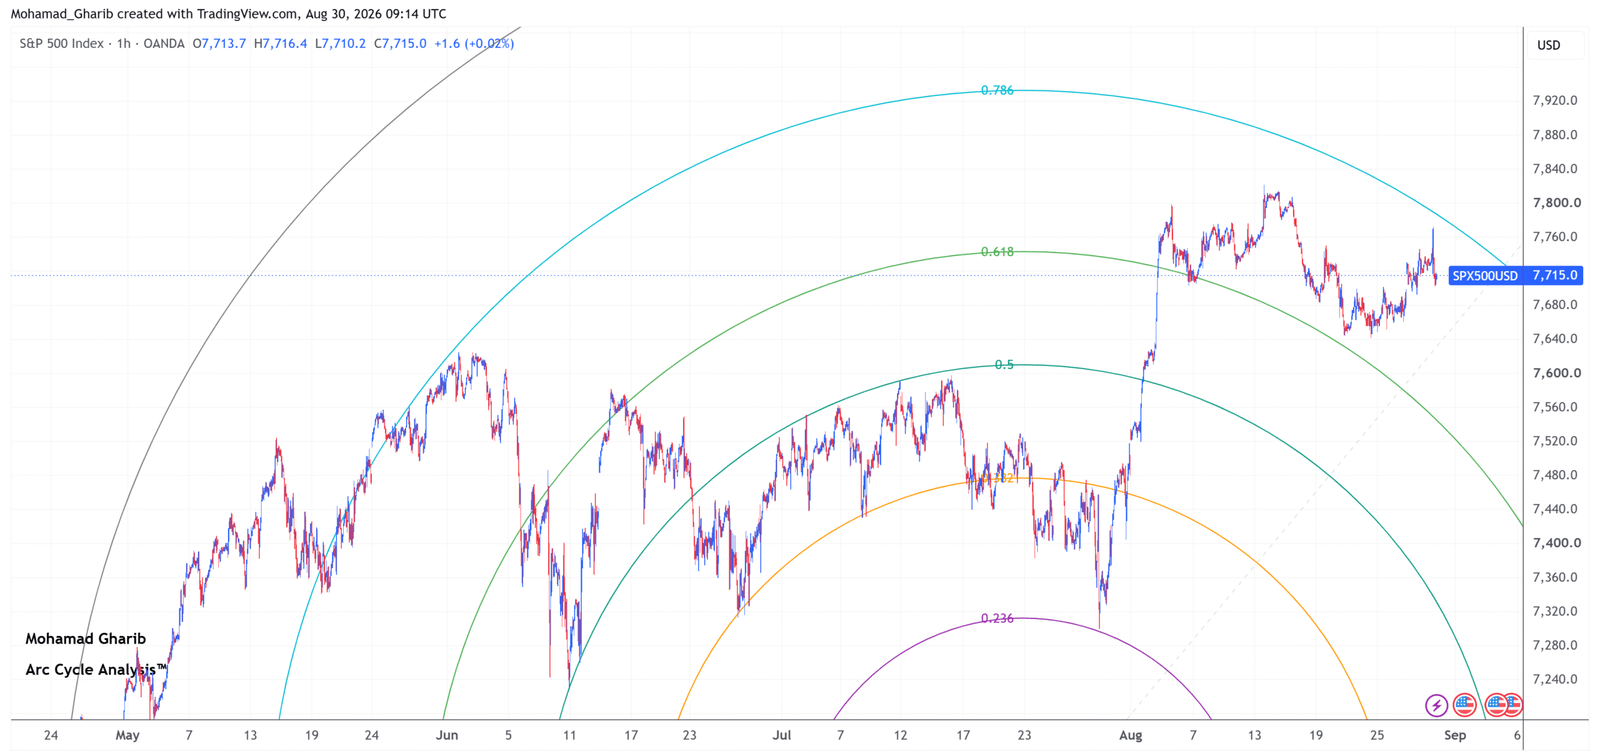
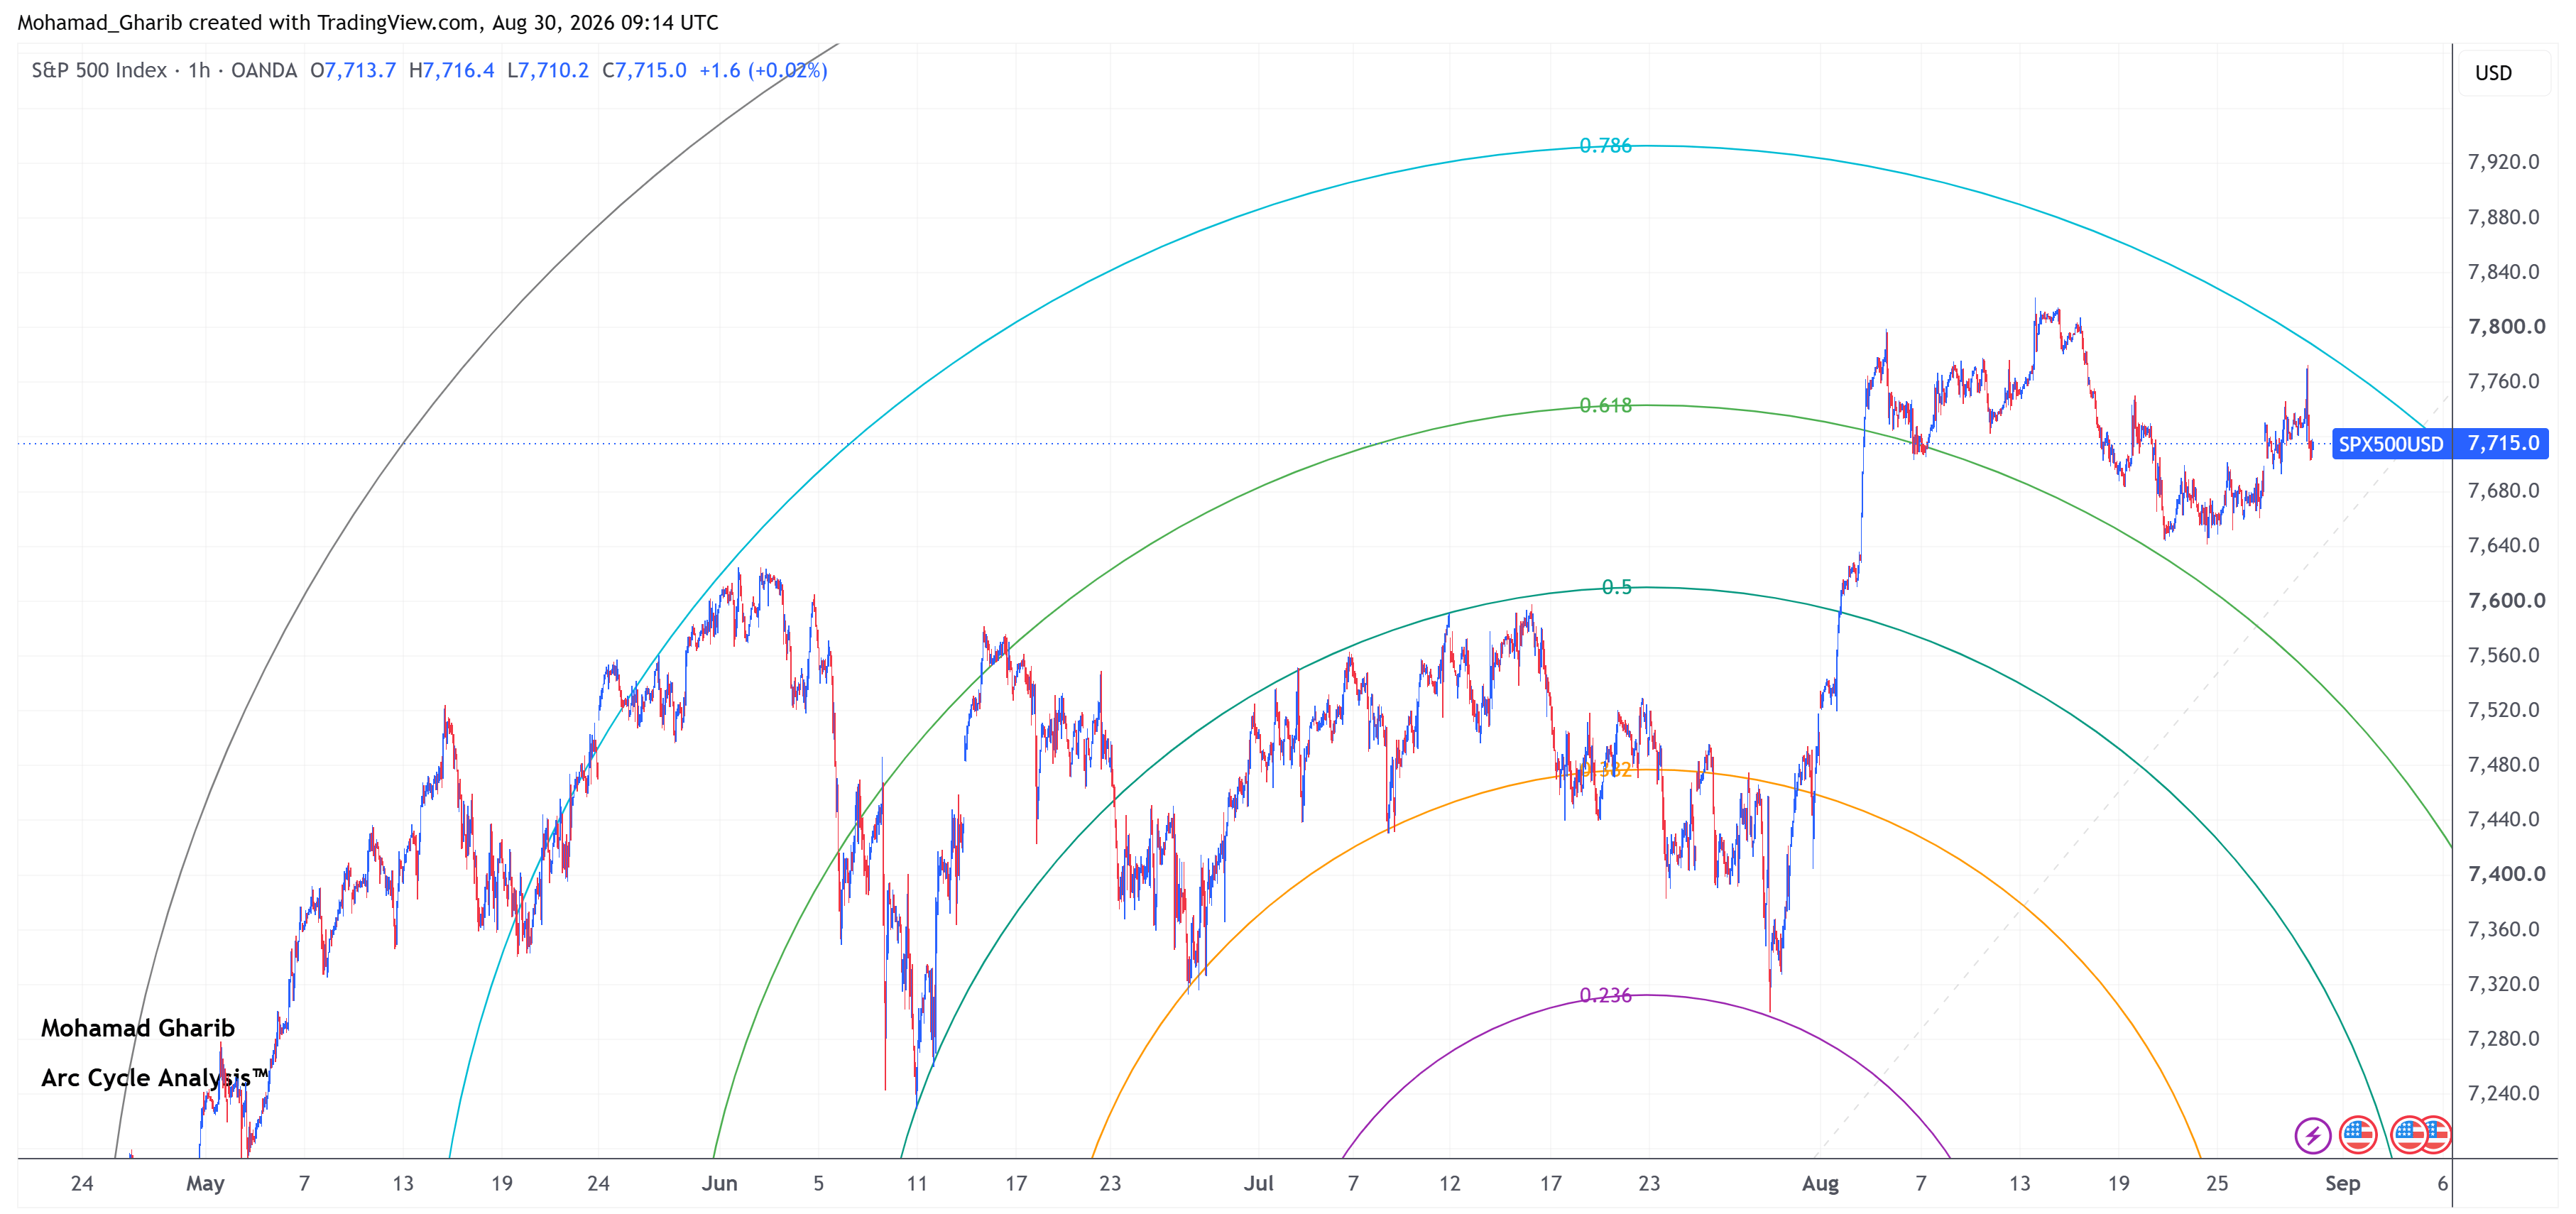
Based on Arc Cycle Analysis applied to the 1h chart, the S&P 500 Index is trading between the 0.618 Arc and 0.786 Arc within the current Arc Cycle. Price has cleared the 0.618 Arc boundary and is progressing toward the 0.786 Arc, suggesting continued movement toward the next Arc boundary.
|
Metric |
Reading |
|
Market Bias |
Bullish |
|
Preferred Scenario |
Potential Continuation / Cycle-to-Cycle Expansion |
|
Primary Target Zone |
7,790 |
|
Scenario Invalidation |
Sustained close back below 7,650 |
|
Current Arc Level |
In Transit Between Arcs (0.618 Arc to 0.786 Arc) |
|
Cycle Status |
Mid-Cycle Migration Phase |
|
Arc Integrity |
Neutral |
Market outlook
Price is trading between the 0.618 Arc and the 0.786 Arc, indicating that the market is progressing through the current Arc Cycle toward the next Arc boundary. If momentum continues, the preferred scenario is continued movement toward the Target Arc at 7,790 (0.786 Arc).
Conversely, a sustained 1h close back below 7,650 (0.618 Arc) would invalidate the continuation scenario and could shift the outlook toward the Previous Arc Cycle.
About The Author