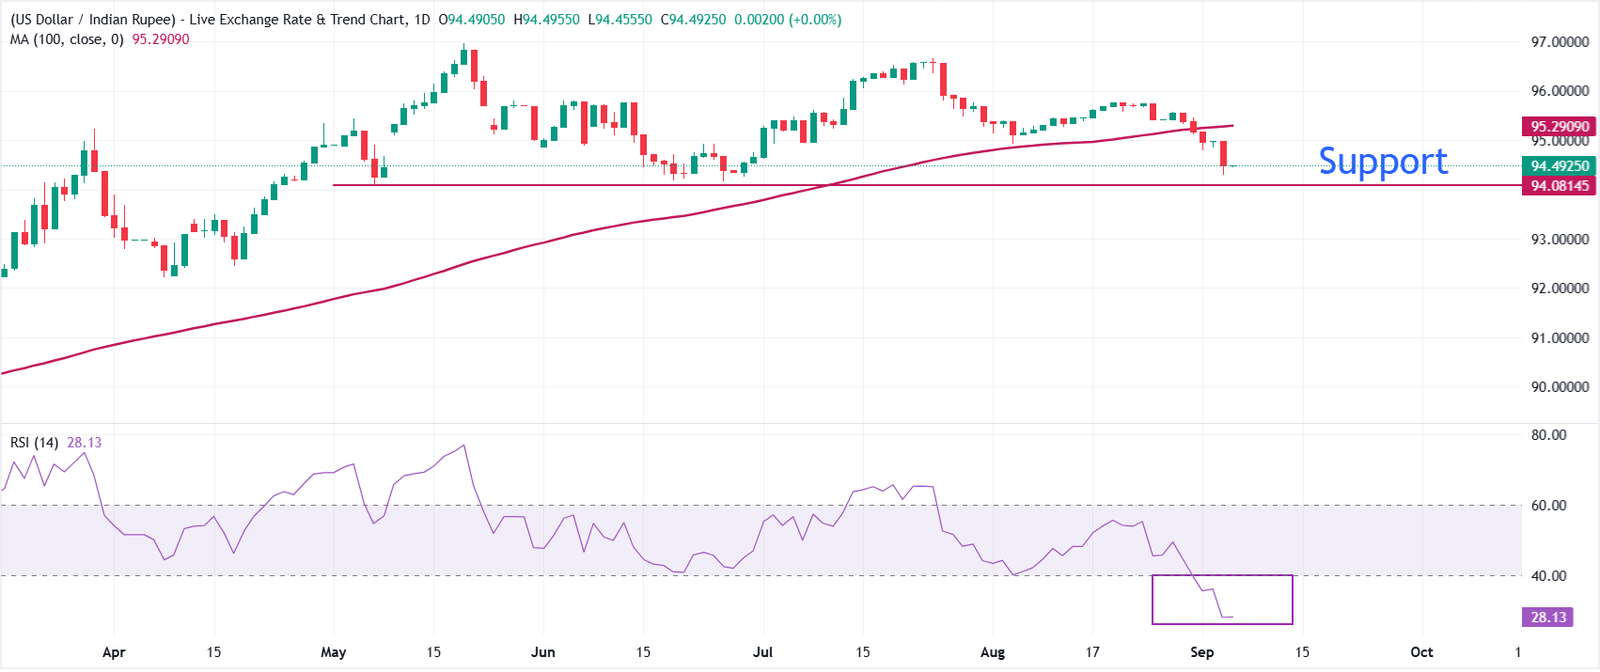
The Indian Rupee (INR) jumps almost 1% higher against the US Dollar (USD) this week. On Friday, the USD/INR pair trades close to its two-month low of 94.29 posted the previous day. The Indian currency strengthened due to strong inflows of foreign funds through the Reserve Bank of India’s Foreign Currency Non-Resident (FCNR) (B) scheme and diminished Federal Reserve (Fed) interest rate hike expectations.
The table below shows the percentage change of Indian Rupee (INR) against listed major currencies this week. Indian Rupee was the strongest against the Swiss Franc.
| USD | EUR | GBP | JPY | CAD | AUD | INR | CHF | |
|---|---|---|---|---|---|---|---|---|
| USD | -0.35% | -0.01% | -2.34% | -0.76% | -0.59% | -0.95% | 0.10% | |
| EUR | 0.35% | 0.35% | -1.98% | -0.41% | -0.26% | -0.72% | 0.47% | |
| GBP | 0.01% | -0.35% | -2.43% | -0.74% | -0.60% | -0.97% | 0.03% | |
| JPY | 2.34% | 1.98% | 2.43% | 1.56% | 1.79% | 2.34% | 2.40% | |
| CAD | 0.76% | 0.41% | 0.74% | -1.56% | 0.16% | 0.68% | 0.79% | |
| AUD | 0.59% | 0.26% | 0.60% | -1.79% | -0.16% | 0.53% | 0.63% | |
| INR | 0.95% | 0.72% | 0.97% | -2.34% | -0.68% | -0.53% | 1.44% | |
| CHF | -0.10% | -0.47% | -0.03% | -2.40% | -0.79% | -0.63% | -1.44% |
The heat map shows percentage changes of major currencies against each other. The base currency is picked from the left column, while the quote currency is picked from the top row. For example, if you pick the Indian Rupee from the left column and move along the horizontal line to the US Dollar, the percentage change displayed in the box will represent INR (base)/USD (quote).
RBI reports strong foreign inflows through FCNR scheme
Strategists at Societe Generale highlight that the RBI has materially strengthened its firepower, noting that “the RBI yesterday disclosed that it had raised $136.38 billion through its FX mobilisation schemes, including the FCNR(B) window launched in early June, significantly bolstering reserve buffers and intervention capacity.”
Fed Waller says recent data indicates signs of slowing inflationary pressures
On Thursday, Fed Governor Christopher Waller said at the Reuters NEXT Newsmaker event, “Finally seeing some signs of disinflation in recent data.” Waller pushing back upside inflation risks resulted in a sharp decline in the US Dollar, with traders paring hawkish Fed bets.
The CME FedWatch tool shows traders see a one-in-two chance that the Fed will hike interest rates at the September meeting, down from a two-in-a-three chance seen before Fed Waller’s speech.
Regarding the Fed’s monetary policy outlook, Governor Waller said that he would “support holding interest rates steady” at the September meeting if the Consumer Price Index (CPI) growth cools down. Waller also kept the option of a rate hike on the table in case the inflation data remains hot. “If August inflation data shows progress has reversed, small adjustment to policy rate would help ensure progress resumes,” he said.
US NFP data awaited
The next major driver for the US Dollar’s outlook is expected to be the US Nonfarm Payrolls (NFP) data for August, which will be published at 12:30 GMT.
Brown Brothers Harriman’s Elias Haddad points out that the latest US labor market read from ADP did little to dispel concerns about cooling demand. He notes that “the ADP August private payrolls data showed labor demand remains unimpressive,” with the economy adding “+38k private sector jobs in August (consensus: +47k) vs. +46k in July, the lowest reading since January.” Haddad cautions, however, that “the correlation between monthly change in ADP private payrolls and nonfarm payrolls (NFP) is weak,” limiting the extent to which investors can extrapolate the ADP miss into Friday’s official employment report.
According to estimates, the US economy is expected to have created 56K fresh jobs after laying off 23K employees in July. The Unemployment Rate is seen steady at 4.1%.
Technical Analysis: USD/INR sees immediate support near 94.08
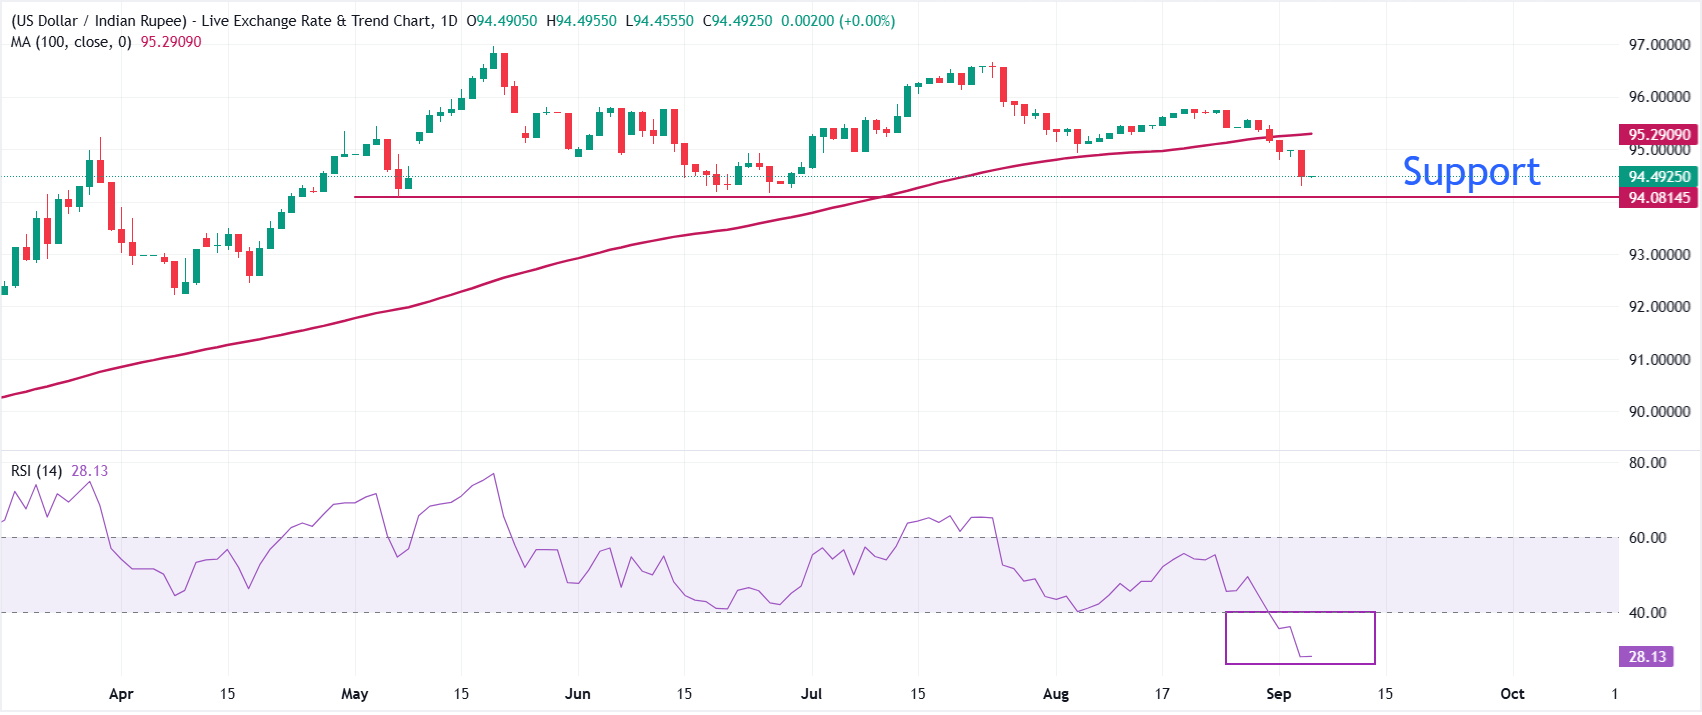
On the daily chart, USD/INR trades at 94.49, extending a downside bias as price holds below the 100-day simple moving average (SMA) at 95.29. The break under this medium-term gauge suggests sellers remain in control, while the Relative Strength Index (RSI) near 28 signals oversold conditions that could slow, but not yet reverse, the prevailing downtrend.
On the downside, the immediate focus remains on how price behaves around the current 94.49 area, as a sustained close beneath it would expose further weakness toward the May low at 94.08. On the topside, a recovery back above the 100-day SMA at 95.29 would be needed to ease bearish pressure and hint at a corrective rebound toward higher levels.
(The technical analysis of this story was written with the help of an AI tool. Know more.)
Nonfarm Payrolls FAQs
Nonfarm Payrolls (NFP) are part of the US Bureau of Labor Statistics monthly jobs report. The Nonfarm Payrolls component specifically measures the change in the number of people employed in the US during the previous month, excluding the farming industry.
The Nonfarm Payrolls figure can influence the decisions of the Federal Reserve by providing a measure of how successfully the Fed is meeting its mandate of fostering full employment and 2% inflation.
A relatively high NFP figure means more people are in employment, earning more money and therefore probably spending more. A relatively low Nonfarm Payrolls’ result, on the either hand, could mean people are struggling to find work.
The Fed will typically raise interest rates to combat high inflation triggered by low unemployment, and lower them to stimulate a stagnant labor market.
Nonfarm Payrolls generally have a positive correlation with the US Dollar. This means when payrolls’ figures come out higher-than-expected the USD tends to rally and vice versa when they are lower.
NFPs influence the US Dollar by virtue of their impact on inflation, monetary policy expectations and interest rates. A higher NFP usually means the Federal Reserve will be more tight in its monetary policy, supporting the USD.
Nonfarm Payrolls are generally negatively-correlated with the price of Gold. This means a higher-than-expected payrolls’ figure will have a depressing effect on the Gold price and vice versa.
Higher NFP generally has a positive effect on the value of the USD, and like most major commodities Gold is priced in US Dollars. If the USD gains in value, therefore, it requires less Dollars to buy an ounce of Gold.
Also, higher interest rates (typically helped higher NFPs) also lessen the attractiveness of Gold as an investment compared to staying in cash, where the money will at least earn interest.
Nonfarm Payrolls is only one component within a bigger jobs report and it can be overshadowed by the other components.
At times, when NFP come out higher-than-forecast, but the Average Weekly Earnings is lower than expected, the market has ignored the potentially inflationary effect of the headline result and interpreted the fall in earnings as deflationary.
The Participation Rate and the Average Weekly Hours components can also influence the market reaction, but only in seldom events like the “Great Resignation” or the Global Financial Crisis.
About The Author